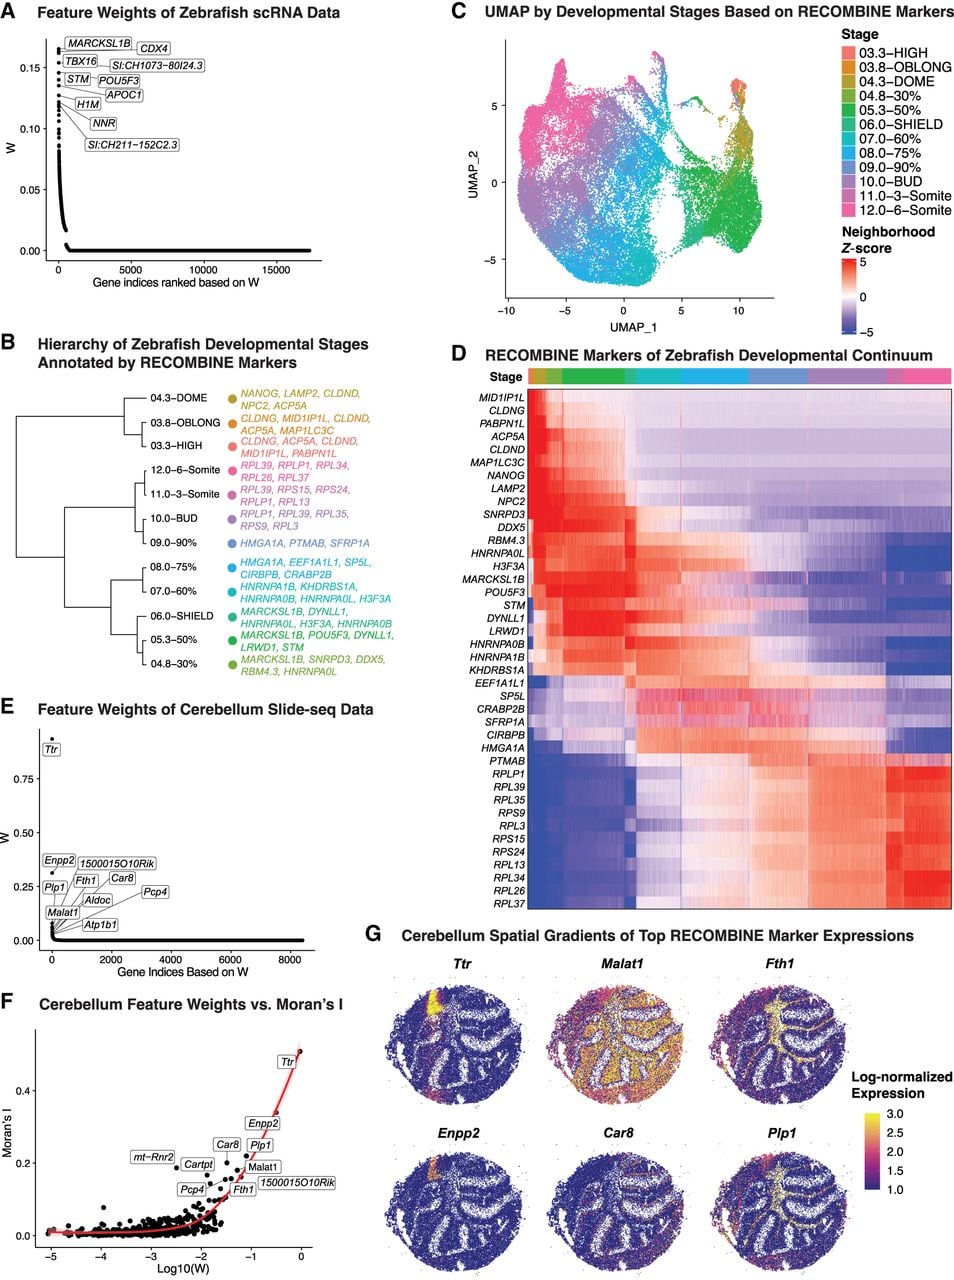
RECOMBINE identifies discriminant markers of transcriptional continuums in zebrafish development and spatial gradients in the mouse cerebellum. (A–D) Zebrafish developmental continuums. (A) Feature weights of all genes, with the top 10 discriminant markers highlighted. (B) Hierarchical tree of developmental stages based on RECOMBINE markers and annotated by the top five markers. (C) UMAP embedding based on RECOMBINE markers, colored by developmental stage. (D) Heatmap of neighborhood Z-scores illustrating transcriptional continuums of RECOMBINE gene modules across developmental stages. (E–G) Mouse cerebellum spatial gradients. (E) Feature weights of all genes, with the top 10 discriminant markers labeled. (F) Correlation between RECOMBINE feature weights and Moran's I, a measure of spatial autocorrelation. (G) Spatial maps depicting expression gradients of top RECOMBINE markers.