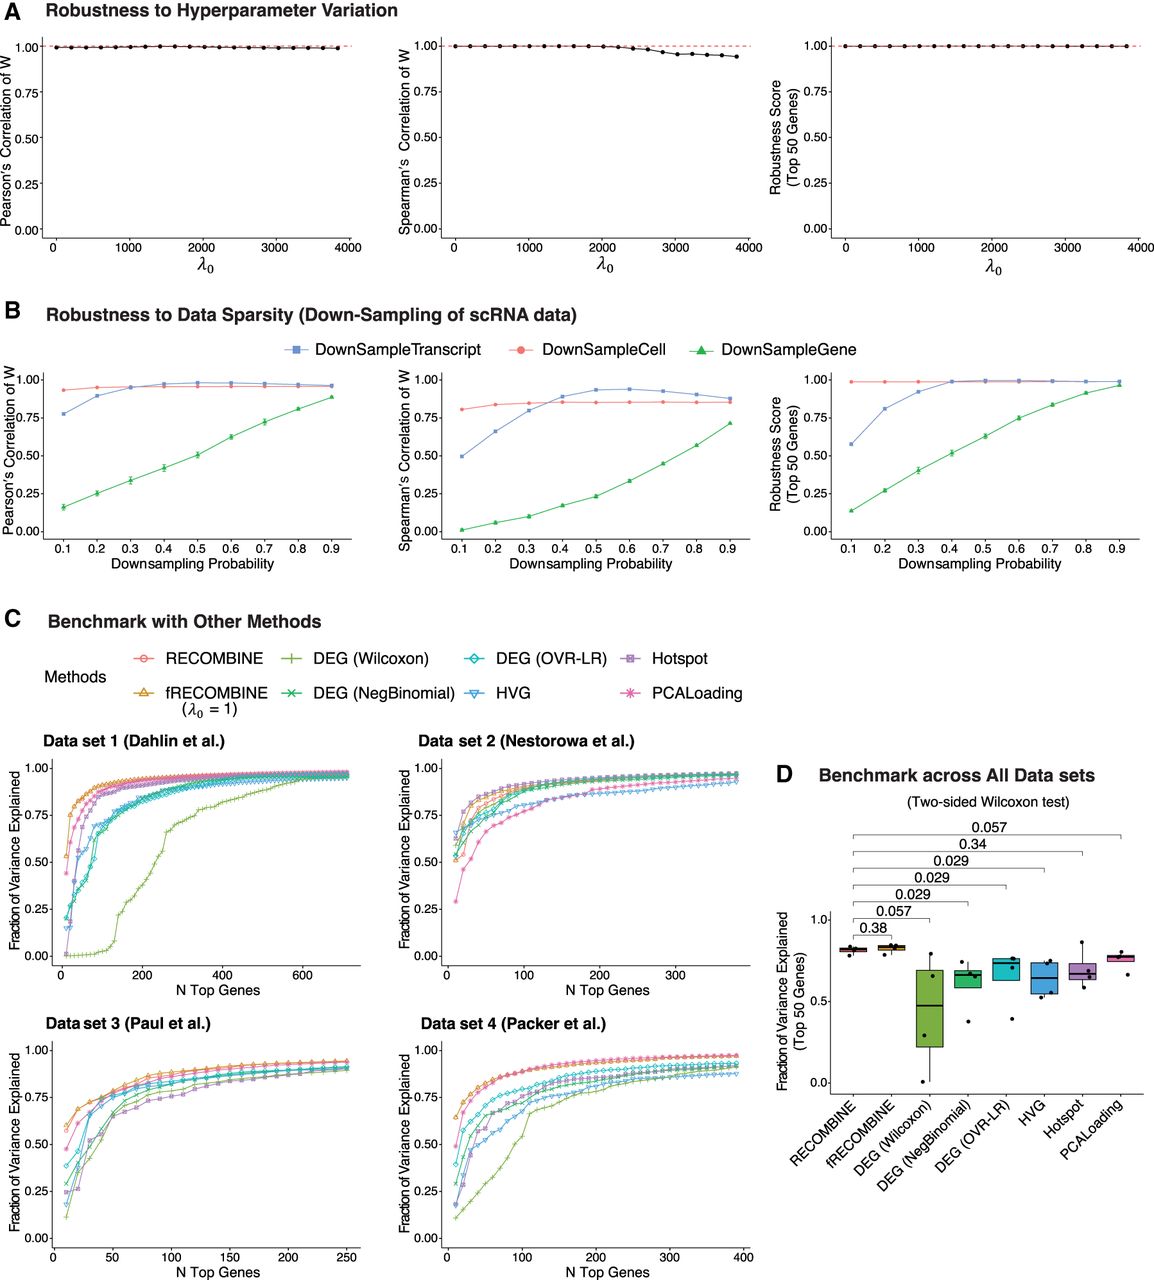
Benchmarking RECOMBINE's robustness and performance relative to other methods. (A) Robustness to hyperparameter variation was evaluated by comparing the gene weights (W) obtained through varying λ0 to the reference weights (Wref) derived from the optimal λ0 selected via the gap statistic. Robustness was quantified using the Pearson's correlation (left), Spearman's correlation (middle), and the robustness score of the top 50 genes ranked by W relative to those ranked by Wref (for details, see Methods). (B) Robustness to scRNA-seq data sparsity was assessed by comparing W from downsampled data sets with Wref from the complete data set. Three types of downsampling were performed: transcript level, cell level, and gene level. (C) Comparison of marker selection among RECOMBINE, fRECOMBINE (λ0 = 1), and other approaches including DEG (Wilcoxon test), DEG (negative binomial test), DEG (OVR-LR), HVG, Hotspot, and PCA loadings. For each method, the number of selected markers was matched to that identified by RECOMBINE. The fraction of variance explained by each method represents the proportion of total variance captured in the top 10 principal components of the complete data set with all genes. The RECOMBINE and fRECOMBINE curves are indistinguishable in data sets 1 and 4, as both methods exhibit identical performance. (D) Fraction of variance explained by the top 50 genes from each method across all data sets. (DEG) Differentially expressed genes; (OVR-LR) one-versus-rest logistic regression; (HVG) highly variable genes.