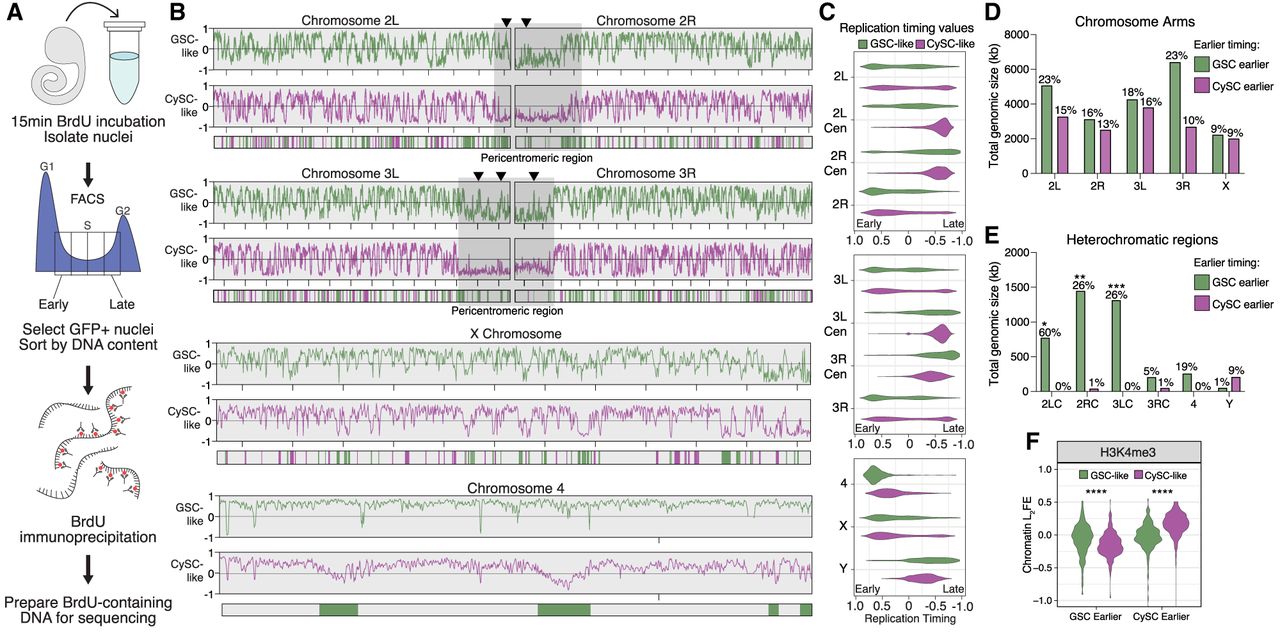
The replication timing profiles of GSC-like and CySC-like cells are distinct. (A) A schematic of the Repli-seq protocol. First, dissected upd tumors are incubated with BrdU, followed by nuclei isolation. GFP-positive nuclei are then sorted by DNA content, separating into one of four S-phase fractions: early, early-mid, late-mid, or late replicating. Next, the BrdU-containing DNA is immunoprecipitated and prepared for sequencing to identify genomic locations undergoing replication within the specific stages of S phase. (B) Replication timing is scored from −1 to 1, with positive values representing early replicating and negative values representing late replicating. Replication timing line plots for GSC-like (green) and CySC-like (magenta) are separated for each chromosome. Below the line plots are the genomic windows in which replication timing significantly differed between the GSC-like and CySC-like cells, for which the color indicates the cell type with earlier replication. Pericentromeric regions on Chromosomes 2 and 3 are indicated by gray boxes. Arrowheads denote example heterochromatic locations at which the GSC-like replication timing is significantly earlier than CySC-like cells. (C) The replication timing values for each chromosome are plotted as violin plots and separated by heterochromatic or euchromatic regions. A Welch's t-test of the logit-transformed violins indicated there is a significant difference in the replication timing values for all comparisons between GSC-like and CySC-like distributions, except the X Chromosome (Supplemental Table S5). (Cen) Pericentromeric heterochromatin. (D,E) Shown is the total genomic size in kilobases for each chromosome for which we rejected the null hypothesis of no difference in timing among GSC-like or CySC-like cells. In general, heterochromatic regions are earlier replicating in GSC-like cells. Above each bar is the percentage of the indicated chromosome that corresponds to the total genomic size that is earlier replicating. Statistical significance was determined by a Fisher's exact test with category aggregation of the chromosome regions (Supplemental Table S6). (F) The log2FE values for H3K4me3 are significantly elevated in regions that are cell-specifically earlier replicating. Statistical significance was determined by a paired-sample t-test (Supplemental Table S5).