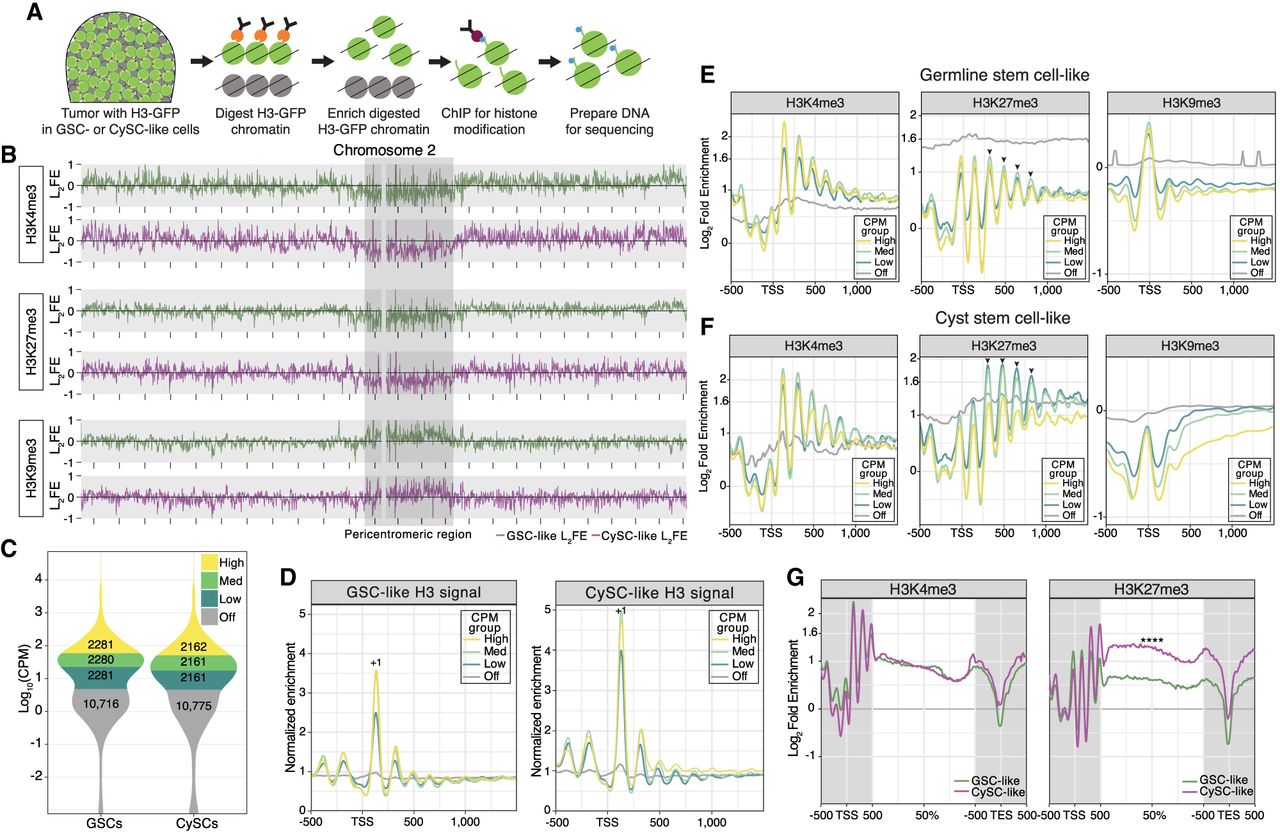
The cell-specific chromatin profiles of H3K4me3, H3K27me3, and H3K9me3. (A) Schematic of the cell-specific chromatin immunocleavage (ChIC) coupled with chromatin immunoprecipitation (ChIP) protocol. Chromatin containing a histone H3-GFP fusion protein is targeted for digestion by antibody-guided MNase. After enriching for digested chromatin, a low-input ChIP protocol is performed for either the H3K4me3, H3K27me3, or H3K9me3 chromatin modification. (B) The log2FE of H3K4me3, H3K27me3, and H3K9me3 along the euchromatic arms and pericentromeric region of Chromosome 2. Enrichment tracks from GSC-like cells are in green, whereas the tracks associated with CySC-like cells are in magenta. The distance between each mark along the x-axis is equivalent to 2 Mb. (C) Using a cut-off of CPM > 5 as “on,” the transcriptomes of the GSC-like and CySC-like clusters obtained from the scRNA-seq were divided into three equal parts to define genes as either off, low, medium, or high expression. (D) Enrichment of mononucleosome fragments (as a density estimation of input monosomal fragment midpoints) is plotted at transcription start sites (TSSs) of genes separated by their expression level as defined in C. The normalized enrichment of mononucleosome fragments was determined by normalizing to the median mononucleosomal fragment count on autosomes. The +1 nucleosome is indicated in each graph. Enrichment at the maximum log2FE value was compared to the “off” gene value using a Welch's t-test for each CPM group, indicating a strong significant difference in fragment enrichment (Supplemental Table S4). (E,F) Cell-specific histone modification enrichment was calculated as the log2FE (Log2[average mark signal/H3 (input) signal]) and then plotted at the TSS of genes categorized by their expression level. Arrowheads indicate the position of nucleosomes at which a difference in H3K27me3 enrichment is observed between the GSC-like and CySC-like chromatin profiles. As done earlier, enrichment at the maximum log2FE value for each CPM group was compared to the “off” gene value using a Welch's t-test, indicating a strong significant difference in modification enrichment (Supplemental Table S4). (G) Comparing the average gene profiles of log2FE along gene bodies between GSC-like and CySC-like cells shows no difference in enrichment for H3K4me3, but a Welch's t-test determined a significant increase in H3K27me3 enrichment in CySC-like cells (Supplemental Table S4).