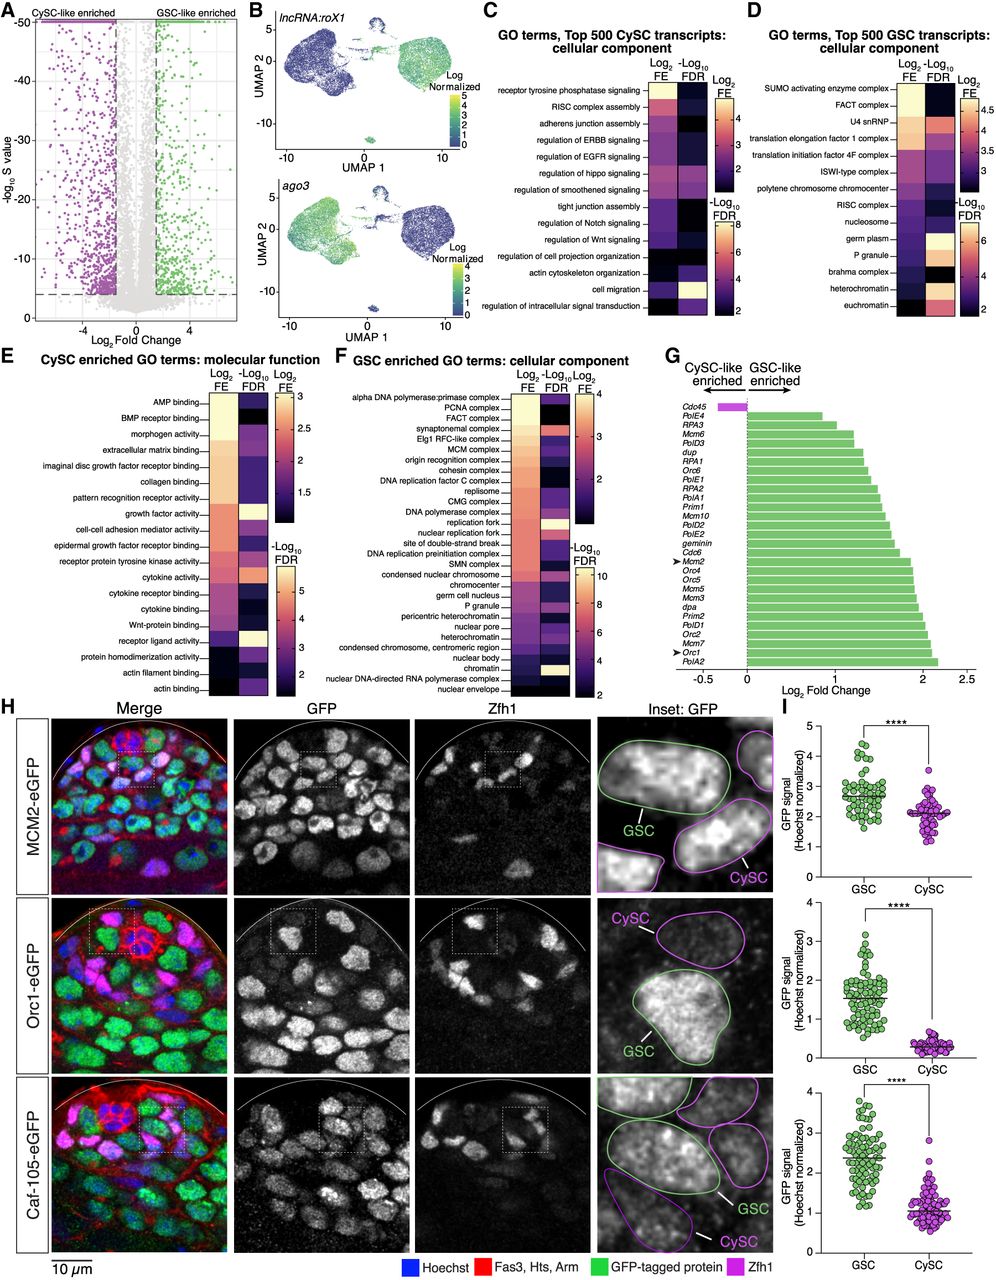
Intercellular communication in CySC-like cells and chromatin-based regulation in GSC-like cells. (A) Differential gene expression analysis between the transcriptomes of the GSC-like and CySC-like data sets. Differentially expressed transcripts are defined as having an absolute fold change difference >1.5 (GSC/CySC) and an estimated false sign rate (S-value) < 10−4. (B) UMAP graphs of two known differentially expressed transcripts demonstrate the accuracy of cluster identification. lncRNA:roX1: log2 fold change (FC) = −6.01, S-value = 0; ago3: log2FC = 3.91, S-value = 0. (C,D) Gene Ontology (GO) analysis of the top 500 highest expressed genes in the CySC-like (at least 246.321917 CPM) and GSC-like (at least 258.44274 CPM) cell clusters. Shown are heatmaps of the log2 fold enrichment (FE) and negative log10 false-discovery rate (FDR) results from the GO analysis. (E,F) GO results for the significantly differentially expressed genes in CySC-like and GSC-like cells. Shown are heatmaps of the log2FE and negative log10FDR results from the GO analysis. (G) Differential transcript expression (log2 GSC/CySC) for select genes involved in DNA replication shows the higher expression of these genes in GSC-like cells (green bars). One gene, Cdc45, is differentially expressed in the CySC-like cells (magenta bar). (H) Confocal images of testis tips from fly strains with the indicated endogenously tagged GFP fusion protein. Expression of each protein is restricted within the mitotically active spermatogonial region. The inset displays a representative z-stack image outlining GSCs (in green) and CySCs (in magenta) that would be used for quantification. (I) The amount of GFP fluorescence within the volume of the nucleus of a GSC or CySC was normalized to the amount of Hoechst staining to produce the GFP signal value for that cell. The spectrosome, a germ-cell-specific organelle, and CySC-specific transcription factor Zfh1 were used to distinguish between GSCs and CySCs (Lin et al. 1994; Leatherman and DiNardo 2008). Two-tailed Mann–Whitney U test, (****) P < 0.0001.