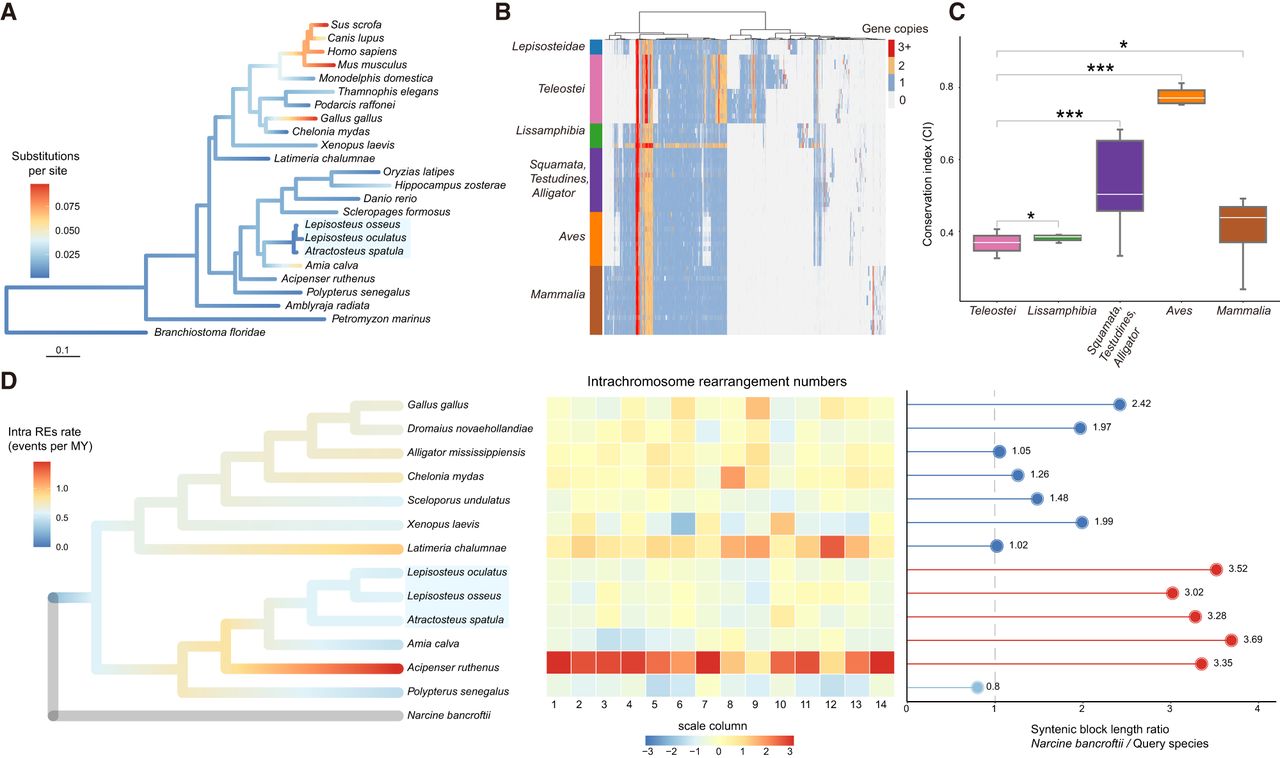
Evolutionary rate of gars compared with diverse phylogenetic lineages. (A) Comparison of whole-genome nucleotide substitution rates using reference-free whole-genome alignments. (B) Heat map showing microsynteny conservation within major vertebrate clades, with gene copy numbers of orthogroups labeled in different colors. (C) Box plot compares the conservation index of major vertebrate clades to that of gars. (D) Chromosomal rearrangements across representative species of major vertebrate clades. Phylogenetic branches are colored according to the average rate of intrachromosomal rearrangements. The heat map displays the number of intrachromosomal rearrangements per chromosome for each species compared to Narcine bancroftii, with varying colors indicating different frequencies. The lollipop chart indicates that gars, Amia calva, and Acipenser ruthenus exhibit a higher syntenic length ratio with Narcine bancroftii compared to other species. This suggests that gars have experienced more significant sequence loss.