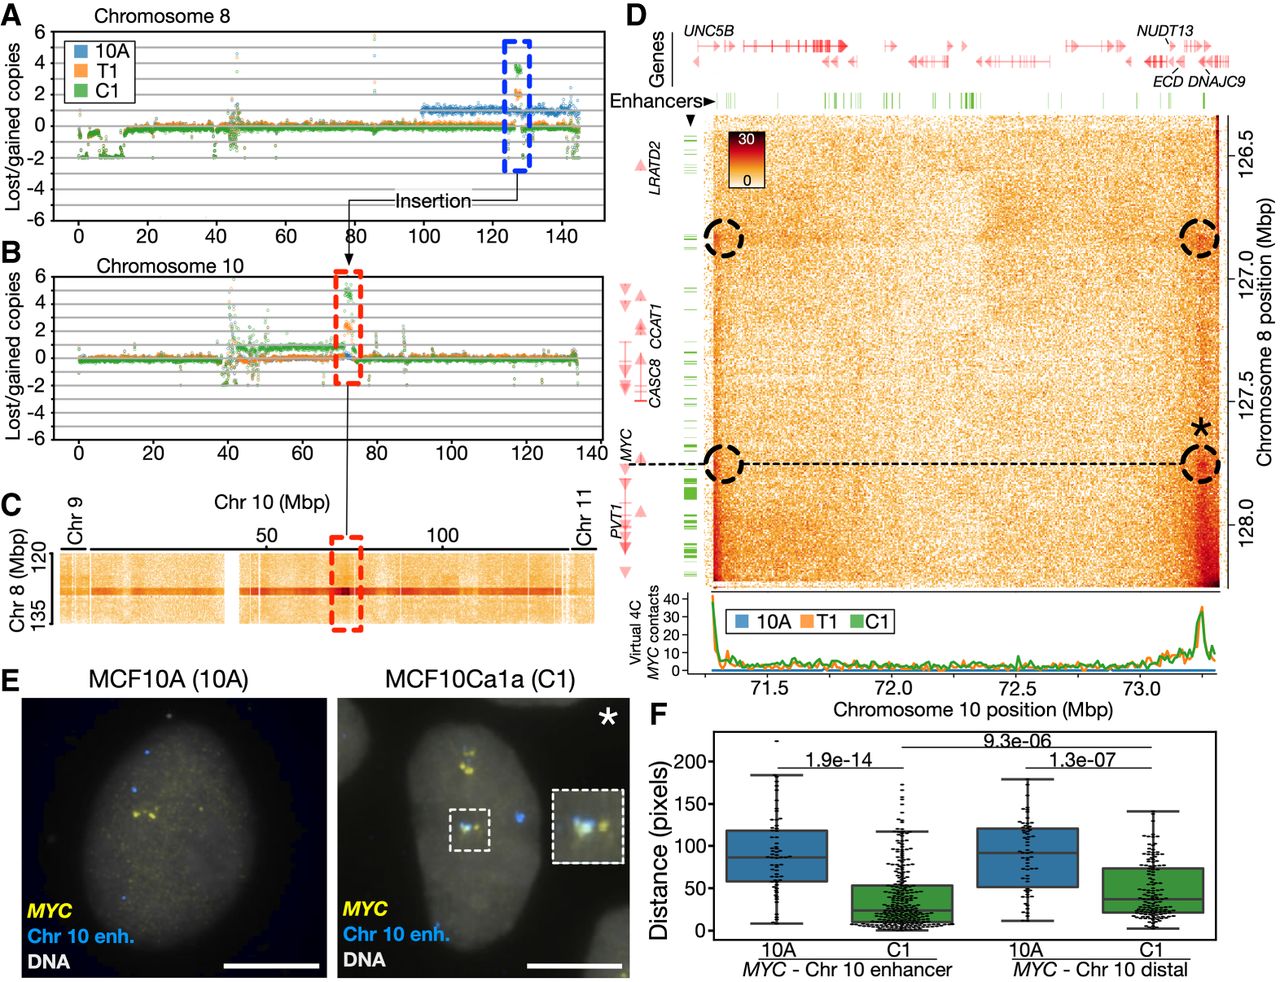
MYC locus insertion on Chromosome 10 is accompanied by de novo contacts with a potential enhancer element. (A) Lost and gained copies for the entire Chromosome 8 in 10A, T1, and C1 cells. The dotted blue box highlights specific amplification of the Chromosome 10 region. (B) Lost and gained copies for the entire Chromosome 10, with a dotted red box highlighting specific amplifications. (C) Interchromosomal C1 Hi-C contacts between the region on Chromosome 8 (vertical axis) and the entire Chromosome 10. Highlighted region from B indicated in red. End of Chromosome 9 and beginning of Chromosome 11 shown on the left and right side, respectively. (D, top) Zoom-in on the C1 Hi-C map of the Chromosome 8/10 amplification unit. Dotted circles indicate enriched “dots” of contacts involving enhancers and MYC. Asterisk marks the enhancer interaction validated in FISH in panels E and F. The dotted line shows the position of the MYC gene on Chromosome 8 relative to contacts on Chromosome 10 within the amplification unit. Positions of enhancers from MCF10A indicated as green segments (top and left). Genes shown in red (top and left), with names for selected genes. (Bottom) Virtual 4C track (see Methods) showing Hi-C contacts from MYC toward the Chromosome 10 region for 10A (blue), T1 (yellow), and C1 (green). (E) FISH image of the MYC gene (yellow) and the Chromosome 10 enhancer (blue; Chr 10 position 73,117,711–73,267,436) expected to interact with MYC from the Hi-C data, in 10A and C1 cells. Bars, 7 µm. (F) Quantification of probe–probe distances in pixels for the MYC–Chr10 enhancer probe pair (left; n = 62 [10A] and 269 [C1] observations) and the MYC–Chr10 distal probe pair (position 73,794,997–73,992,612; n = 62 [10A] and 140 [C1] observations). N = 28–95 nuclei analyzed. P-values are shown (Kolmogorov–Smirnov test).