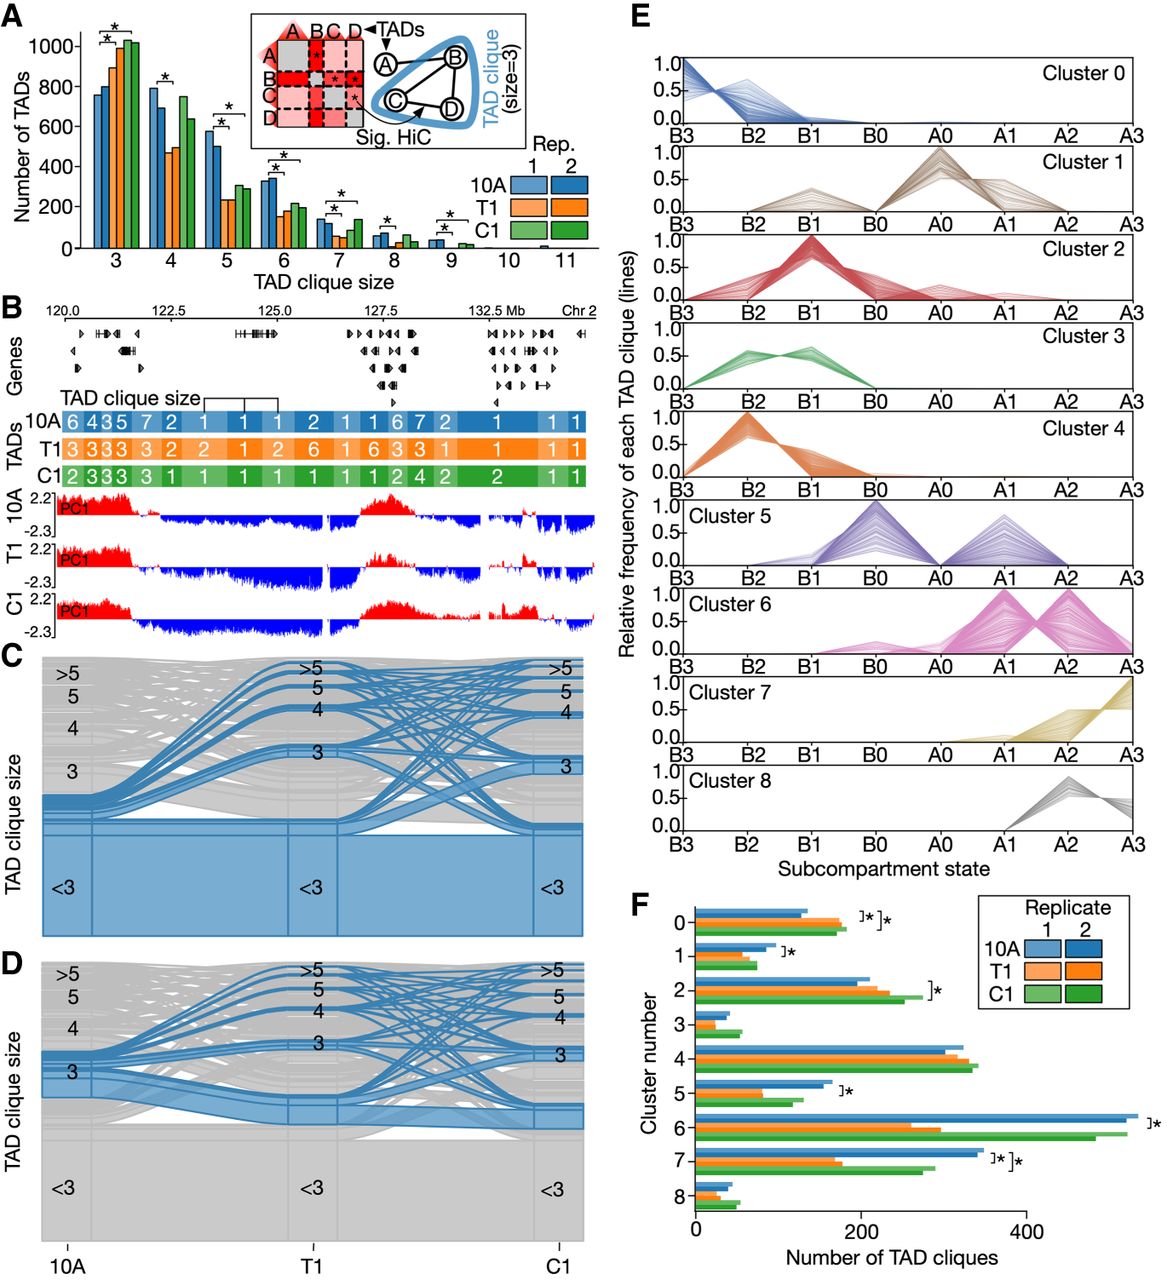
TAD clique dynamics during breast cancer progression stages. (A) Absolute number of TADs in cliques with maximal size ranging from three to 11 shown for each of the three breast cancer stages. Asterisks indicate significant differences (see Supplemental Table S10). Inset illustrates how “TAD cliques” are identified from the statistically significant Hi-C interactions between TADs. (B) Example region on Chromosome 2 showing changes in TAD clique sizes and compartment eigenvalues. (C) Alluvial plots highlighting the alluvial path of a nonclique in 10A across the three cancer stages. (D) Alluvial path of a TAD clique of size 3 in 10A. (E) TAD clique clustering into nine clusters based on their enrichment in subcompartments in the same cell type (vertical axis). Each line represents a TAD clique. (F) Numbers of TAD cliques belonging to each of the clusters in E. Asterisks indicate significant differences (see Supplemental Table S12). For numbers in the “mixed” cluster, see Supplemental Figure S40.