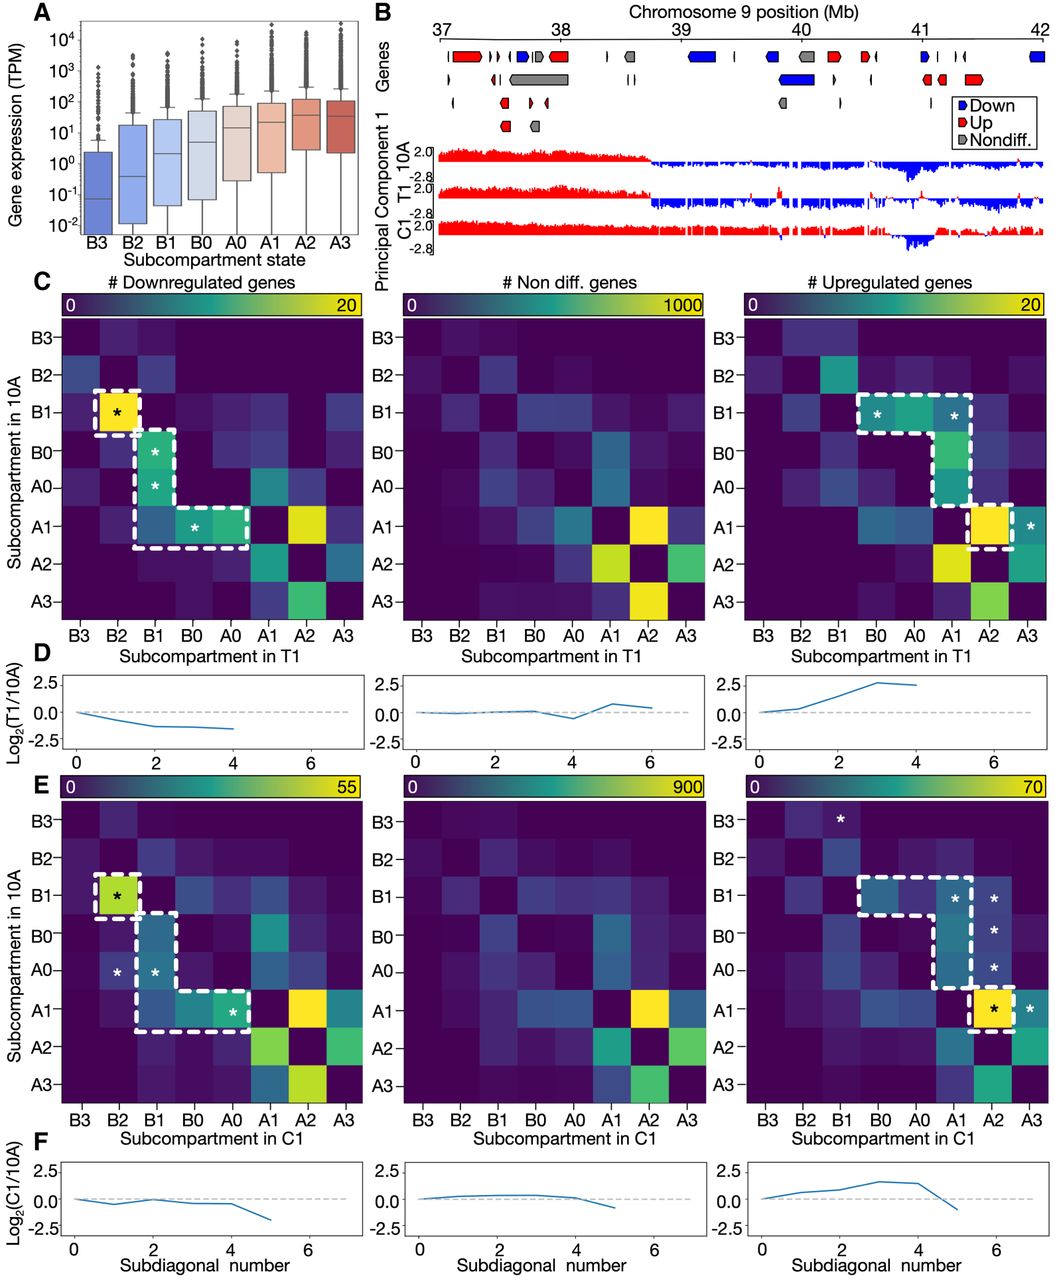
Coordinated changes in subcompartments and gene expression. (A) Gene expression levels (TPM) by subcompartment state (protein-coding genes; MCF10A [replicates merged]). Vertical axis in log scale. (B) Example of subcompartment switching on Chromosome 9. Up- and downregulated genes in C1 versus 10A indicated in red and blue, respectively. (C) Heatmaps showing number of DE downregulated genes (left), nondifferential genes (middle), and upregulated genes (right) in subcompartments switching between 10A (vertical axis) and T1 (horizontal axis). Dotted lines highlight regions with enrichment relative to nondifferential and upregulated genes. Asterisks indicate significant differences (see Supplemental Table S6). (D) Log2-ratio of number of genes in subdiagonal sums in the upper versus lower triangular matrices of the corresponding heatmap from C. Ratio not displayed for subdiagonal sums that are equal to zero. (E) Heatmaps as in C but contrasting 10A with C1. Dotted lines highlight regions with enrichment relative to nondifferential and downregulated genes. Asterisks indicate significant differences (see Supplemental Table S7). (F) Log2-ratio plots as in D, but contrasting 10A with C1.