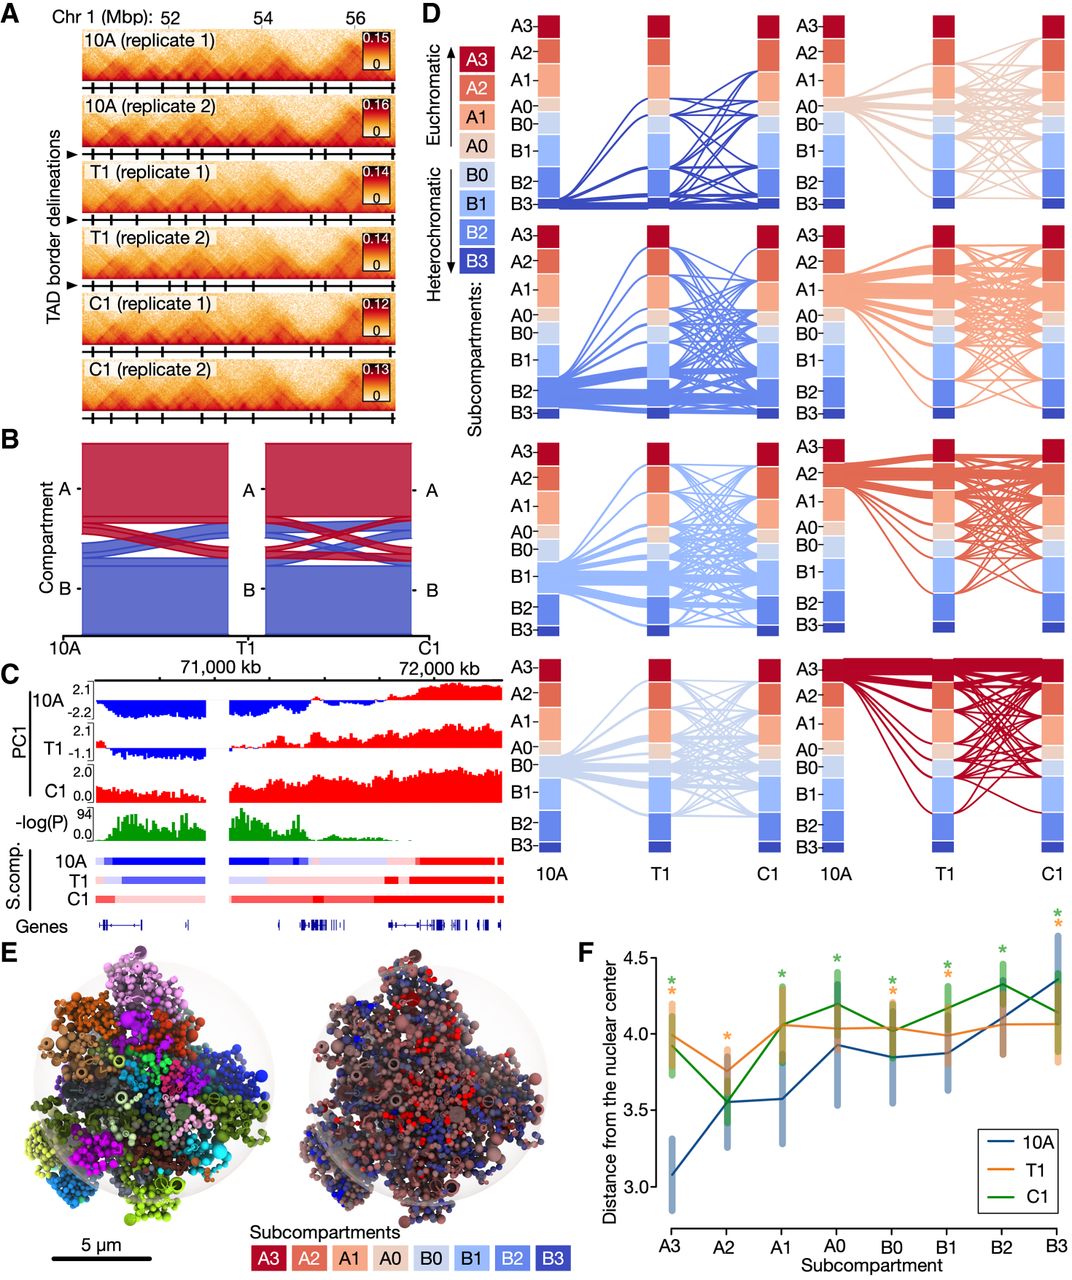
Alterations in genome compartment properties during breast cancer progression stages. (A) Example Hi-C data for a region on Chromosome 1. TAD delineations are shown as black vertical lines below each track. (B) Alluvial plot showing A/B-compartment conservation and switching during progression from 10A (left), via T1 (middle) and to C1 (right). (C) Example region on Chromosome 11 showing a statistically significant switch in the first principal component (PC1) in the three stages. Corresponding subcompartments in the three stages (10A, T1, C1) are shown below. (D) Switching between four A-type subcompartments (A0–A3), and four B-type (B0–B3) called from the Hi-C data (shown in distinct colors). Subcompartment switches across 10A, T1, and C1 shown as separate alluvial plots starting at each of the eight different subcompartments in 10A. (E, left) Tomographic view of exemplary Chrom3D model from 10A cells with chromosomes colored individually. (Right) The same model with regions colored by their subcompartment associations. (F) Median distance (with standard deviation) from the nuclear center for each subcompartment in each condition. Asterisks indicate significant differences in T1 and C1 compared with 10A (see Supplemental Table S4).