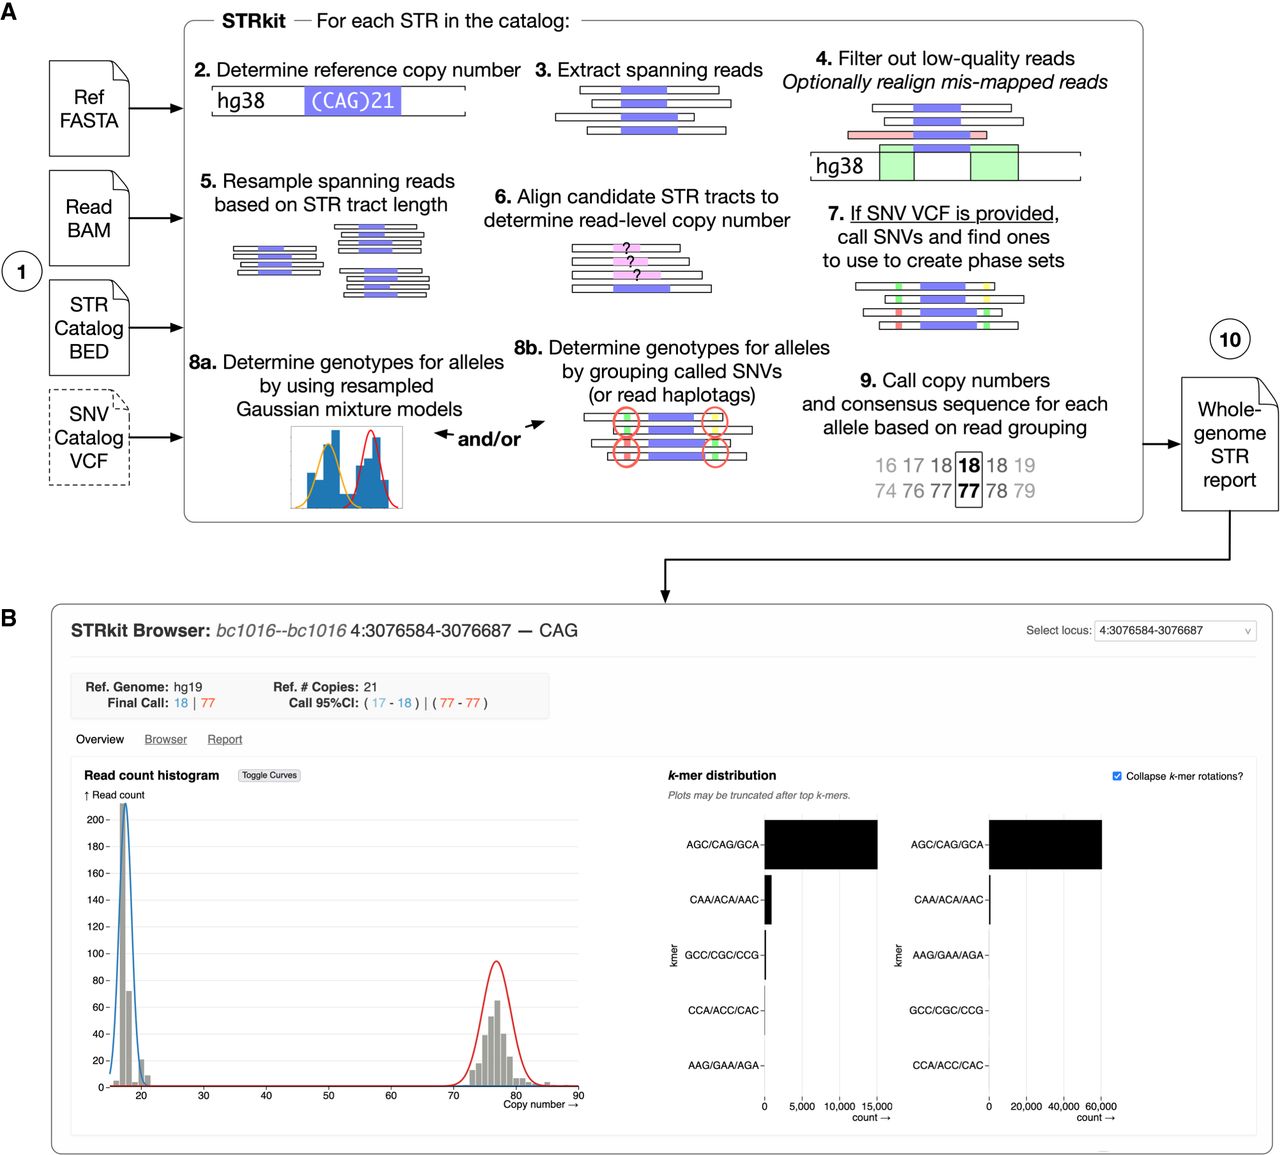
Figure 1.
Flowchart of the STRkit genotyping and visualization workflow. (A) The genotyping workflow (also see Methods). Our approach includes an optional SNV incorporation step, which can find heterozygous SNVs proximate to STRs and use them to cluster reads to call STR alleles. (B) Users can explore the generated report in the STRkit visualization tool. The read count histogram shows the read-level distribution of copy numbers for the locus. Here, a pathogenic expansion in the HTT gene is shown. The k-mer distribution plots show motif-sized k-mer sequence diversity among read STR sequences for each allele peak.