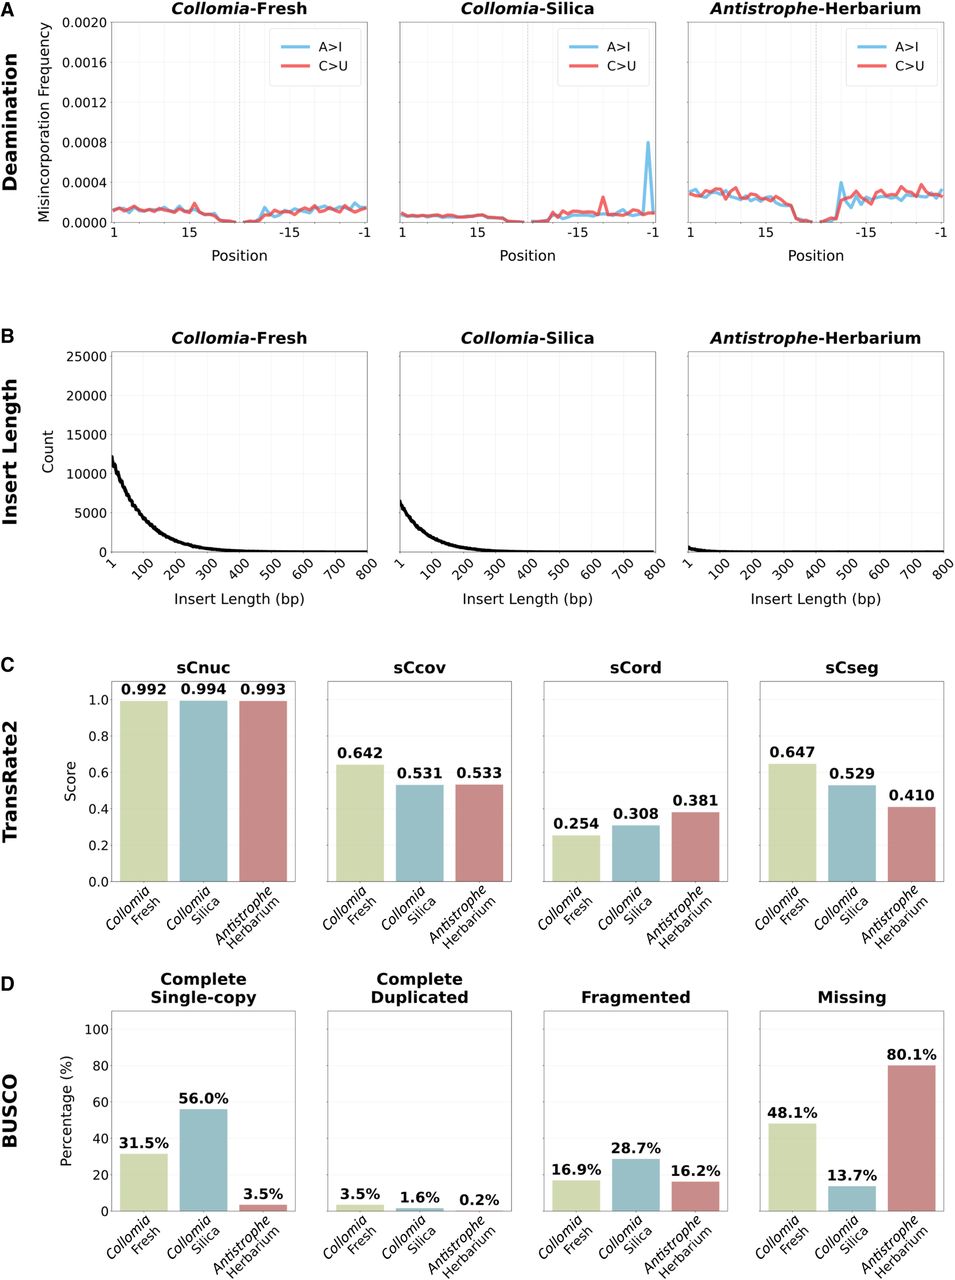
Quality assessment of sequenced and assembled RNA from representative samples for each preservation method. The quality analysis results for one representative from each preservation treatment are shown here; results for all samples are available in Supplemental Figures 1 through 3. (A) Deamination levels for adenosine to inosine (A > I) and cytidine to uridine (C > U). The plots show position-specific nucleotide misincorporations from the 5′ (left) and 3′ (right). (B) The length of the insert for the sequenced fragments. (C) The scores for TransRate2 broken into different predicted error types: reliability of the base pair calls (sCnuc), the coverage level of the transcript (sCov), the pairing of the mapped reads (sCord), and evidence of chimerism within the transcripts (sCseg). (D) The BUSCO scores for each sample.