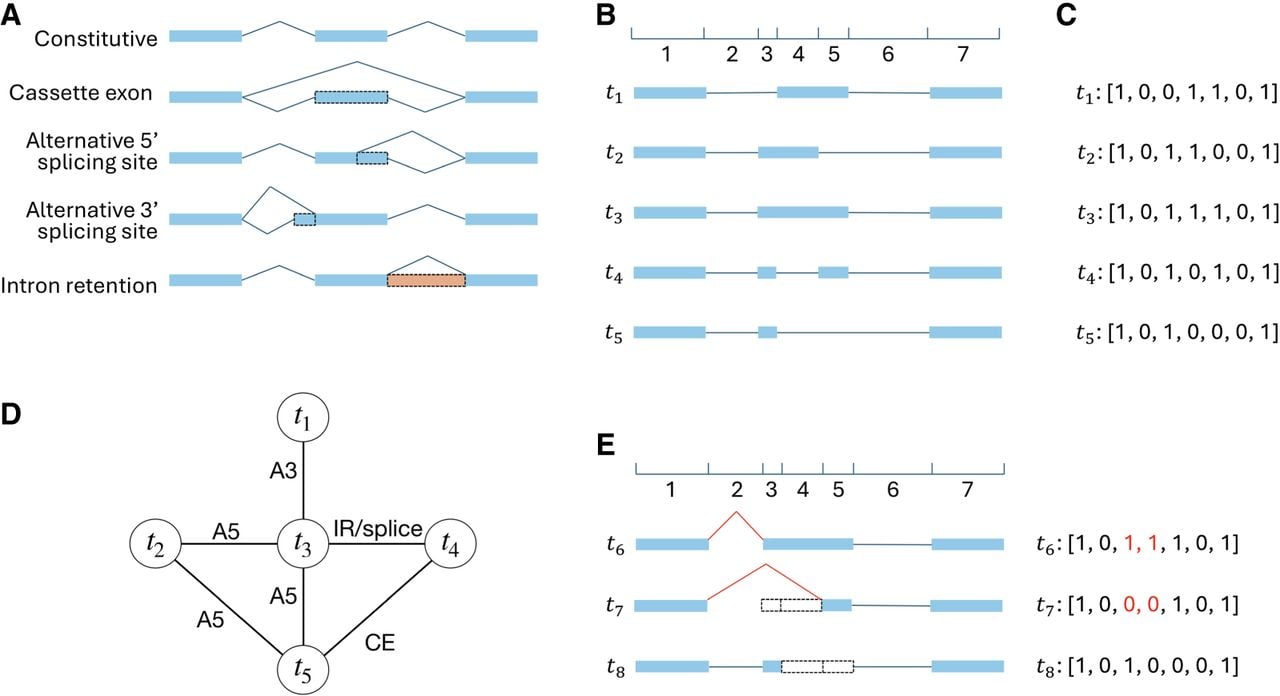
Alternative splicing events and transcript-group representation. (A) Constitutive isoform splicing and four basic alternative splicing types. Blue rectangle: exon; Peach rectangle: retained intron; Dashed rectangle: alternative (partial) exon/intron; Blue polyline: splice junction. (B) Splice sites of all transcripts divide the genome into several sub-regions. This example shows a group of 5 transcripts (t1, t2, t3, t4, t5) that divides the genome into 7 regions. (C) Each transcript is encoded as a binary vector indicating which regions are spliced in (1) or spliced out (0). This example encodes each panel B transcript as a vector of length 7. The whole transcript group is represented as a 5 × 7 binary matrix. (D) Potential AS events between panel B transcripts. Only exactly one basic AS event is considered between each pair of transcripts. t1 is convertible to t3 by one A3 event, t2 to t3 by one A5 event, t2 to t5 by one A5 event, t3 to t4 by one intron retention or splicing event, t3 to t5 by one A5 event, t4 to t5 by one cassette exon event. (E) Skipping multiple consecutive partial exons is one AS event. The red splice junctions and binary bits illustrate that converting t6 to t7 is one A3 event, but two consecutive partial exons are skipped. Similarly, converting t6 to t8 is one A5 event (junctions not shown). However, converting t7 to t8 requires two basic AS events, because the changed partial exons (3rd and 5th) are not consecutive and one is skipped while the other is included. CE: cassette exon; A5: alternative 5′ splice sites; A3: alternative 3′ splicing site; IR: intron retention.