Skip to main content
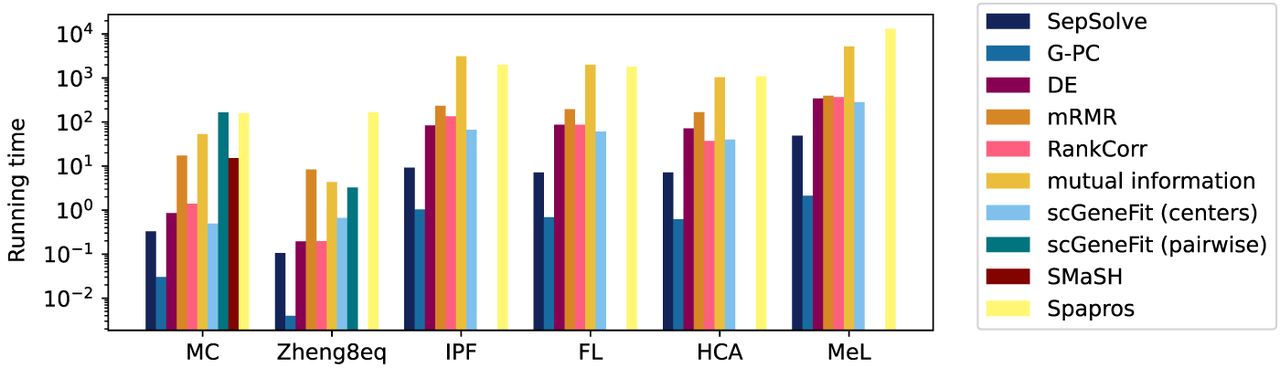
Figure 5.
Average running times (log scale, in seconds) over all evaluated target numbers of marker genes.