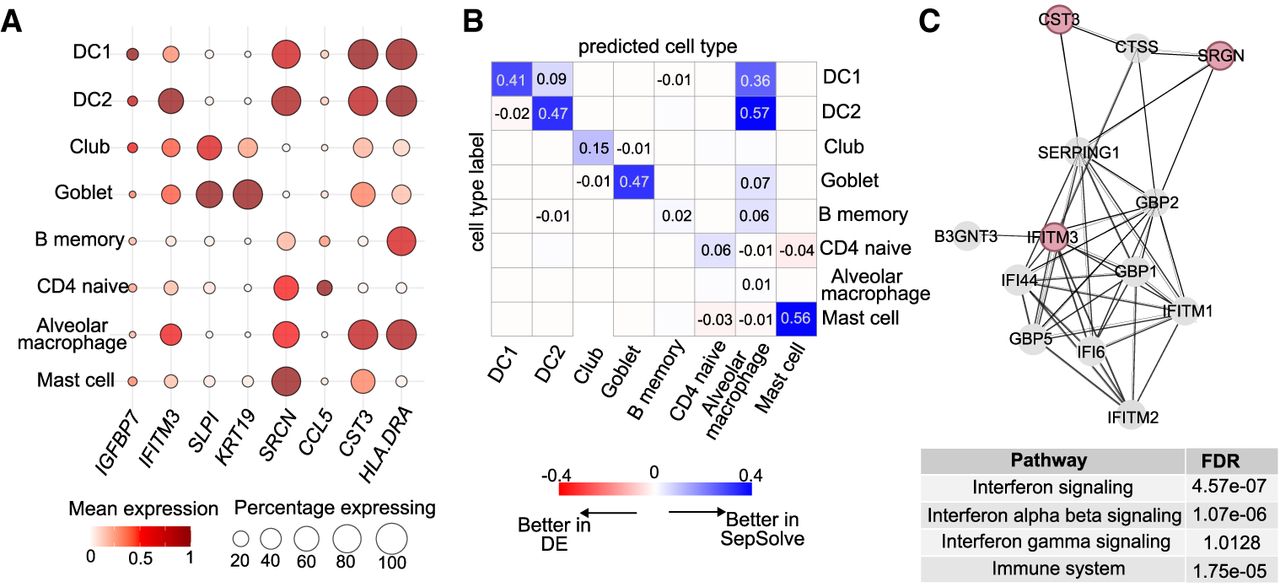
Markers selected by SepSolve on the MeL lung single-cell data set. (A) Each dot's color represents the scaled mean expression of a marker within a specific cell type, normalized across all cell types. The size of each dot corresponds to the percentage of cells within that cell type expressing the marker. (B) Confusion matrix heatmap comparing cell classification accuracy between markers identified by SepSolve and those selected via differential expression analysis. Positive values (blue) indicate superior classification accuracy using SepSolve markers, whereas negative values (red) denote better performance with differential expression markers. (C) Protein–protein interaction network centered on IFITM3, SRGN, and CST3, constructed using the STRING database. Nodes represent proteins, and edges denote predicted functional associations based on various evidence types, including curated databases and experimental data. The accompanying table lists pathways enriched within this network, along with their associated false-discovery rate (FDR) values. (DC1) Type 1 dendritic cell, (DC2) type 2 dendritic cell, (DE) differential expression.