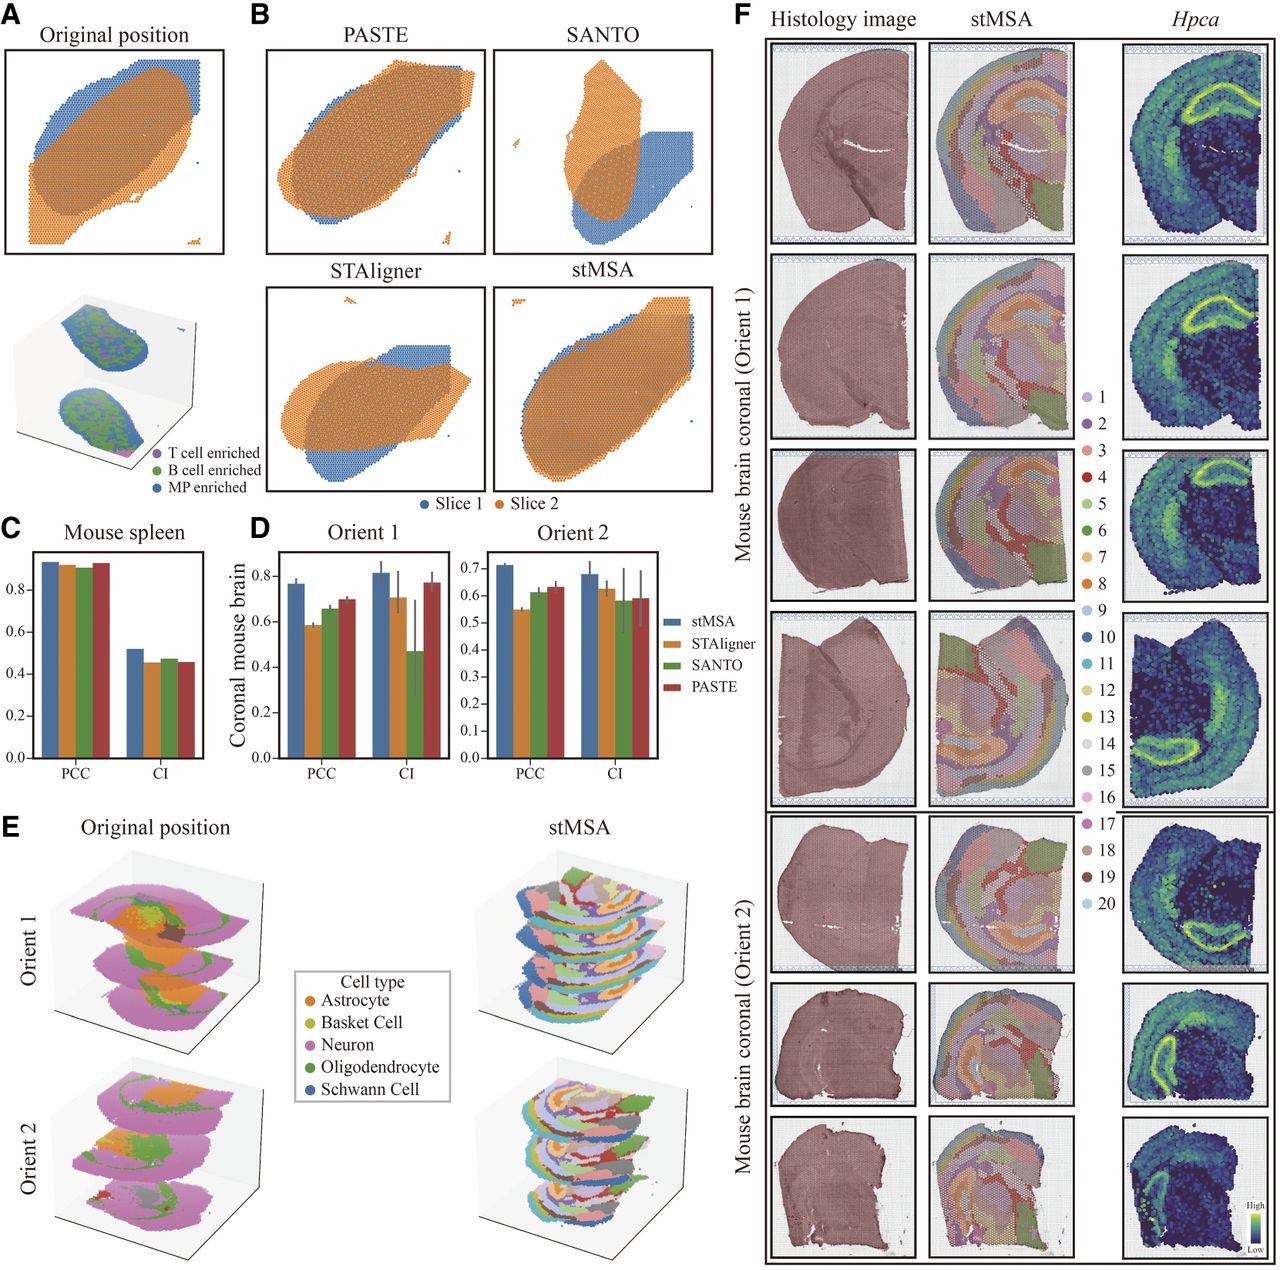
The alignment performance of stMSA on multislice SO data sets. (A) Original unaligned 2D/3D spatial coordinates from the mouse spleen data set. (B) Comparative visualization of alignment results from stMSA and three benchmark methods on the mouse spleen data set. (C) Quantitative evaluation of alignment performance using PCC and CI scores. Error bars represent the 95% confidence intervals of the PCC and CI scores. (D) Alignment robustness assessment across different anatomical orientations (coronal sections) of the mouse brain, measured by PCC and CI. (E) 3D reconstruction of original (left) and stMSA-aligned (right) spatial coordinates, demonstrating accurate spatial preservation. (F) Original coronal mouse brain orientation, stMSA-derived spatial domains, and pyramidal cell layer marker gene spatial distribution.