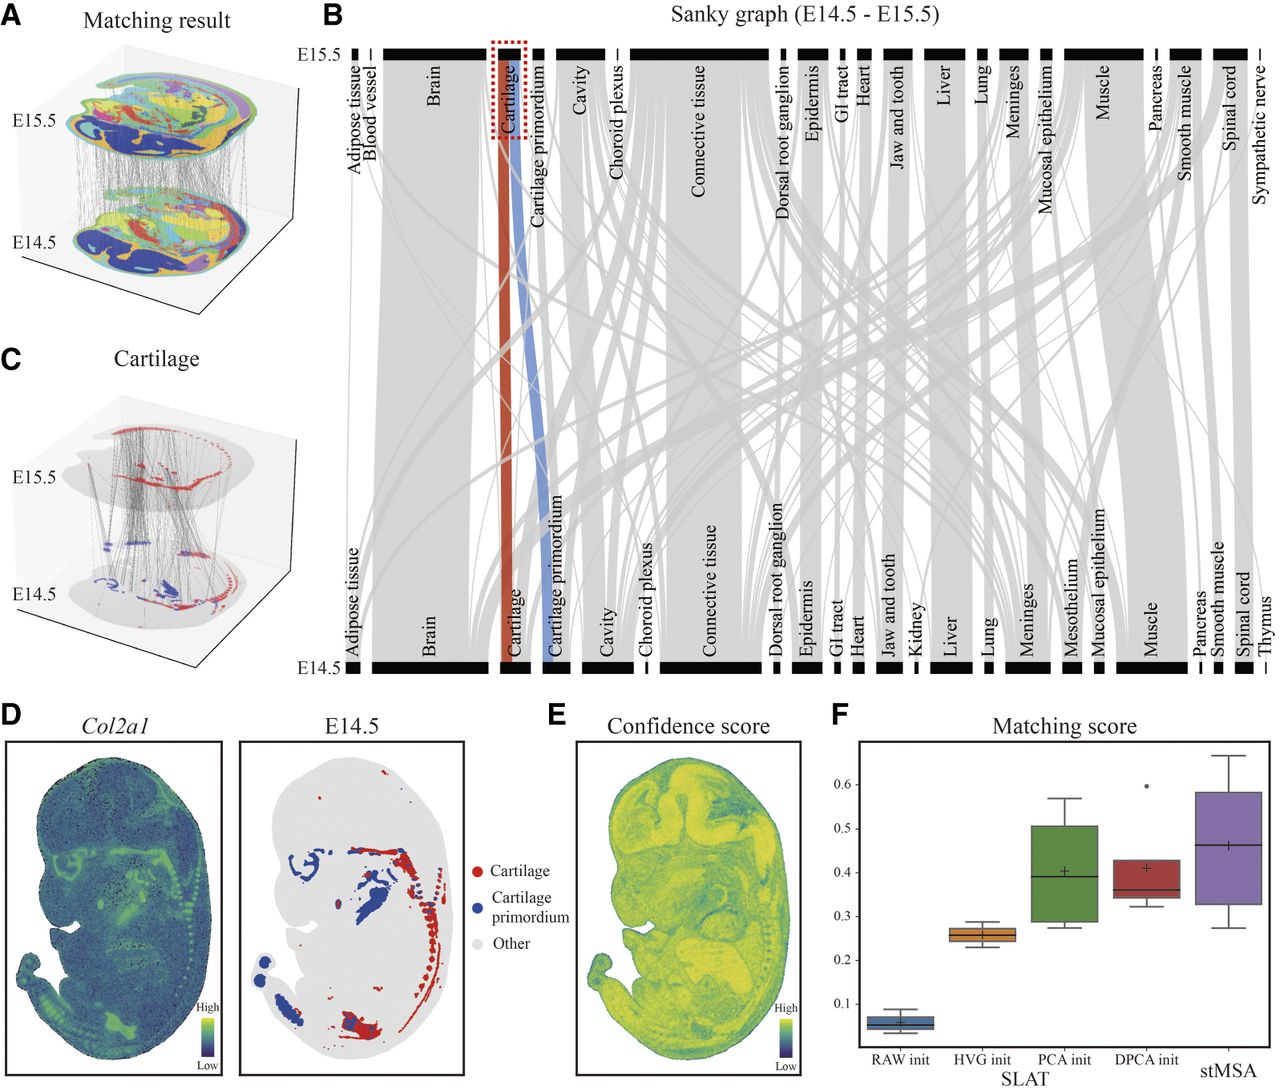
stMSA demonstrates effective tissue matching abilities in the Mouse Organogenesis Spatiotemporal Transcriptomic Atlas (MOSTA) data set. (A) Visualization of the cross-slice matching results between the E14.5 and E15.5 stages of mouse embryo. To improve the clarity of the matching results, 500 matched spot pairs were randomly selected. (B) The Sankey graph illustrating the tissue matching between the E14.5 and E15.5 stages, with a highlighted path showcasing the matching relation between cartilage and cartilage primordium. (C) Matched spot pairs specifically focusing on the cartilage–cartilage primordium relationship at the E14.5 and E15.5 stages. (D) Marker gene expression patterns and spatial domain distributions of cartilage and cartilage primordium at the E14.5 stage. (E) Confidence scores of the matching results. The confidence scores quantify the accuracy of cross-slice cell type matches, with higher scores reflecting stronger alignment confidence. For each spot, the score is computed as the proportion of matched cell type pairs relative to the total identified pairs (cell type–matched pairs/total pairs). Thus, a higher score indicates greater precision in the biological correspondence for that spot. (F) Comparison of the matching scores between stMSA and SLAT under different settings (RAW, HVG, PCA, and DPCA init).