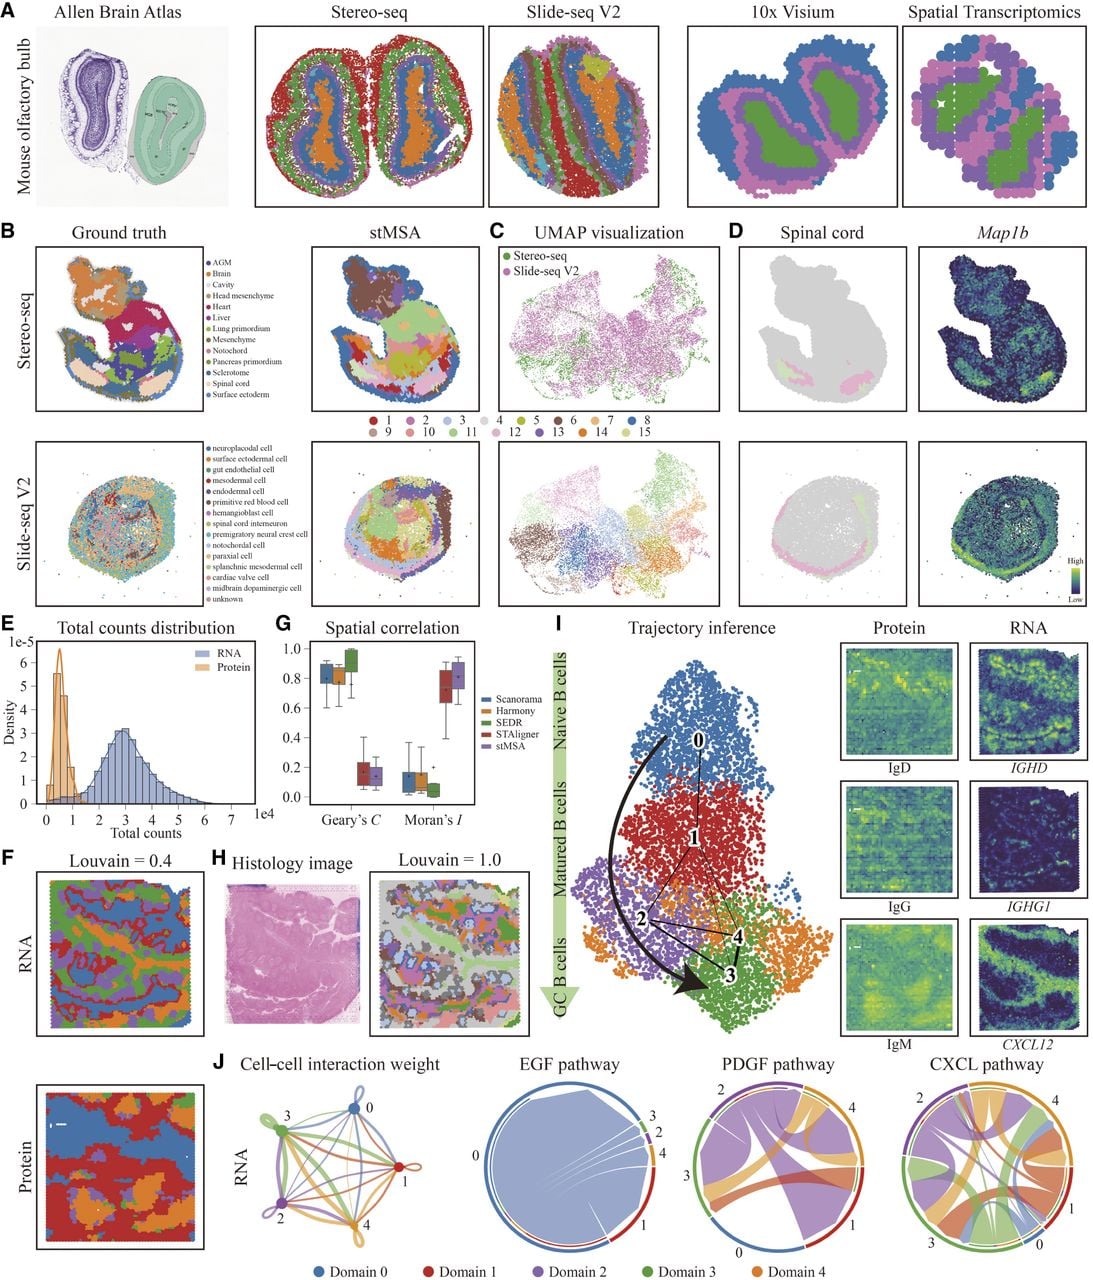
stMSA achieves robust performance across diverse sequencing platforms, different data set sizes, and multiomics data. (A) The Allen Brain Atlas and the domain identification results for the Stereo-seq and Slide-seq V2 platforms and 10x Visium and spatial transcriptomics platforms for mouse olfactory bulb slices. (B) The manual annotations and the domain identification result of stMSA in the Stereo-seq-obtained and Slide-seq V2–obtained mouse embryo data set. (C) The UMAP visualization of the distribution of different sequencing platforms and the clustering result. (D) The spatial distribution of spinal cord region stMSA predicted and its corresponding marker gene. (E) The total RNA and protein count distribution in the human tonsil data set. (F) The domain identification results for the human tonsil protein and RNA data set, with the Louvain resolution set to 0.4. (G) The spatial correlation score Geary's C and Moran's I for the latent representation generated by Scanorama, Harmony, SEDR, STAligner, and stMSA. For Geary's C, a low C-score indicated high correlation, and for Moran's I, a high I-score indicated high correlation. (H) The histology image and the domain identification result for the human tonsil RNA data set, with the Louvain resolution set to 1.0. (I) The trajectory inference for the human tonsil data set and the corresponding spatial distribution of the protein marker and gene marker for the naive B cells (IgD/IGHD), Matured B cells (IgG/IGHG1), and GC B cells (IgM/CXCL12). (J) The cell–cell communication analyses for the five domains stMSA identified.