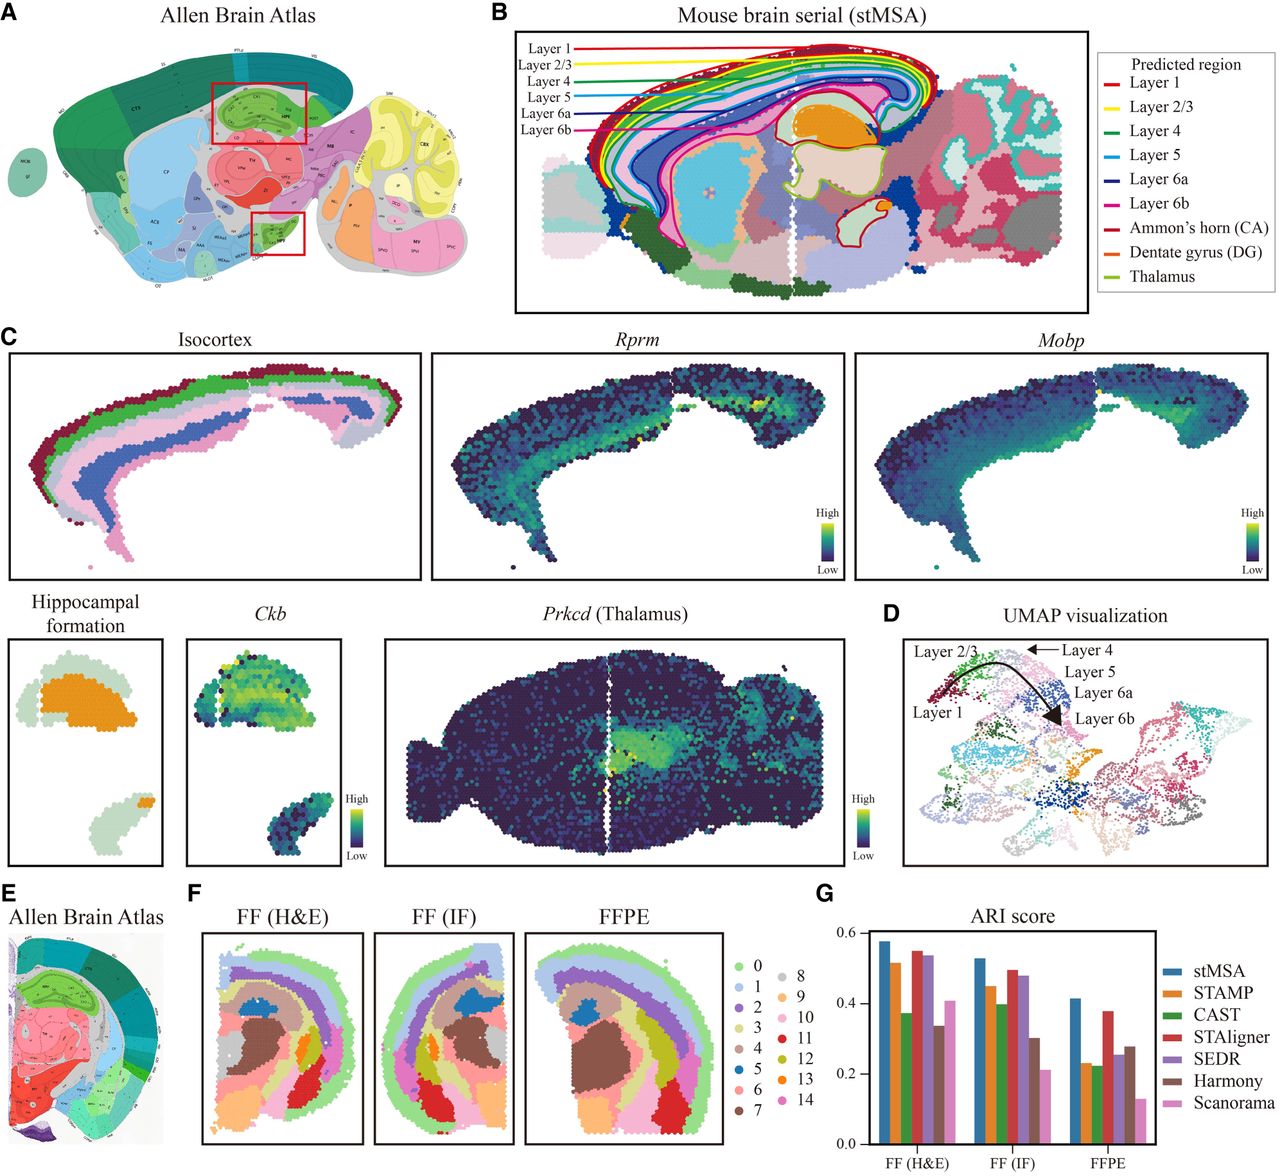
stMSA can identify cross-batch tissue structures in the 10x Visium–obtained mouse brain data set. (A) The anatomical structure of the sagittal mouse brain provided by the Allen Brain Atlas. (B) Spatial domains predicted by stMSA with manually annotated landmark domains (isocortex from layer 1 to layer 6b, hippocampus, and thalamus). (C) Subdomains of the isocortex, hippocampus, and thalamus, along with the expression levels of their corresponding marker genes. (D) The UMAP visualization of latent embeddings derived by stMSA. The substructures of the isocortex from layer 1 to layer 6b are manually annotated on the plot. (E) The anatomical structure of the coronal mouse brain provided by the Allen Brain Atlas. (F) The clustering result of stMSA in fresh-frozen with H&E-stained, DAPI-stained, and FFPE-preserved coronal mouse brain slices. (G) The ARI clustering score for stMSA and other state-of-the-art methods in the three coronal mouse brain slices.