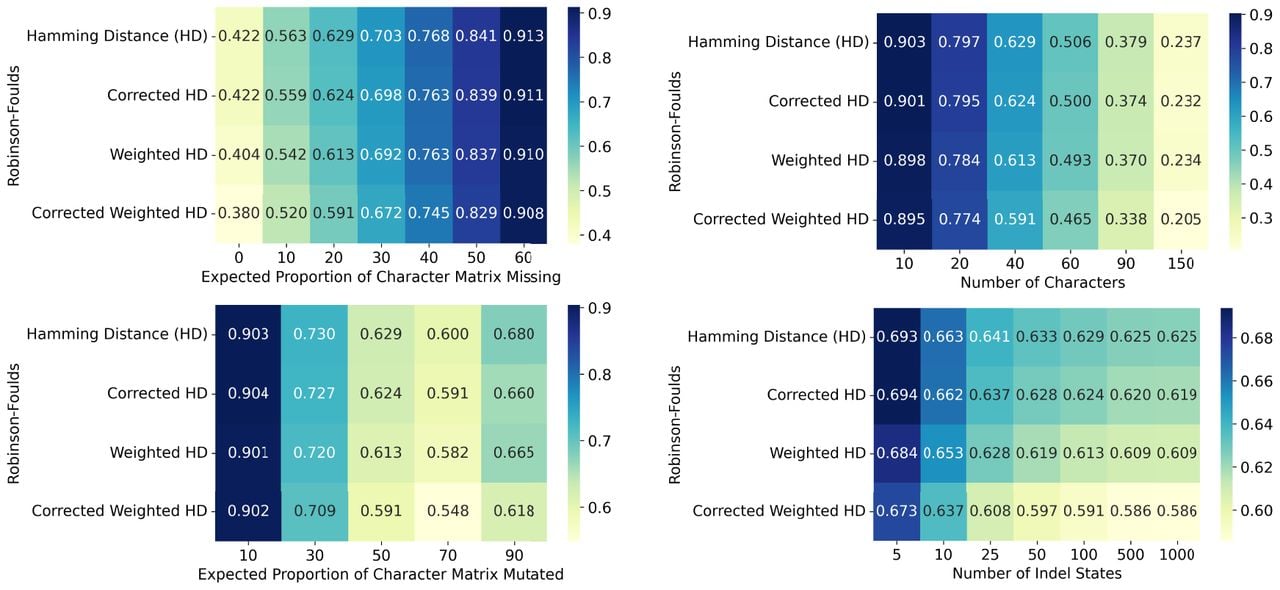
Using corrected distances improves tree reconstruction on simulated CRISPR-Cas9 data. Using simulations, we compare the performance of Neighbor Joining on uncorrected Hamming and weighted Hamming Distance metrics against their corrected versions as outlined in Theorem 5. Each simulation analysis includes 250 trees, each with 400 leaves. As default parameters, we set the number of characters to 40 and set the mutation rate so that approximately of sites get mutated. We also set the distribution of mutation outcomes q to an exponential distribution, following previous results in real data (Jones et al. 2020) (Supplemental Fig. S2). Each of these parameters is explored in a range of values, while fixing all other parameters at their default values. Here we use the Robinson-Foulds performance metric (lower values are better). Each entry is the average performance of 250 repetitions. The complete set of simulation results, varying simulation parameters and performance metrics as well as comparing to other algorithms, can be found in Supplemental Figures S4–S17. The details for these are given in the Simulation Details (Supplemental Text S6) and is summarized in Supplemental Text S3.