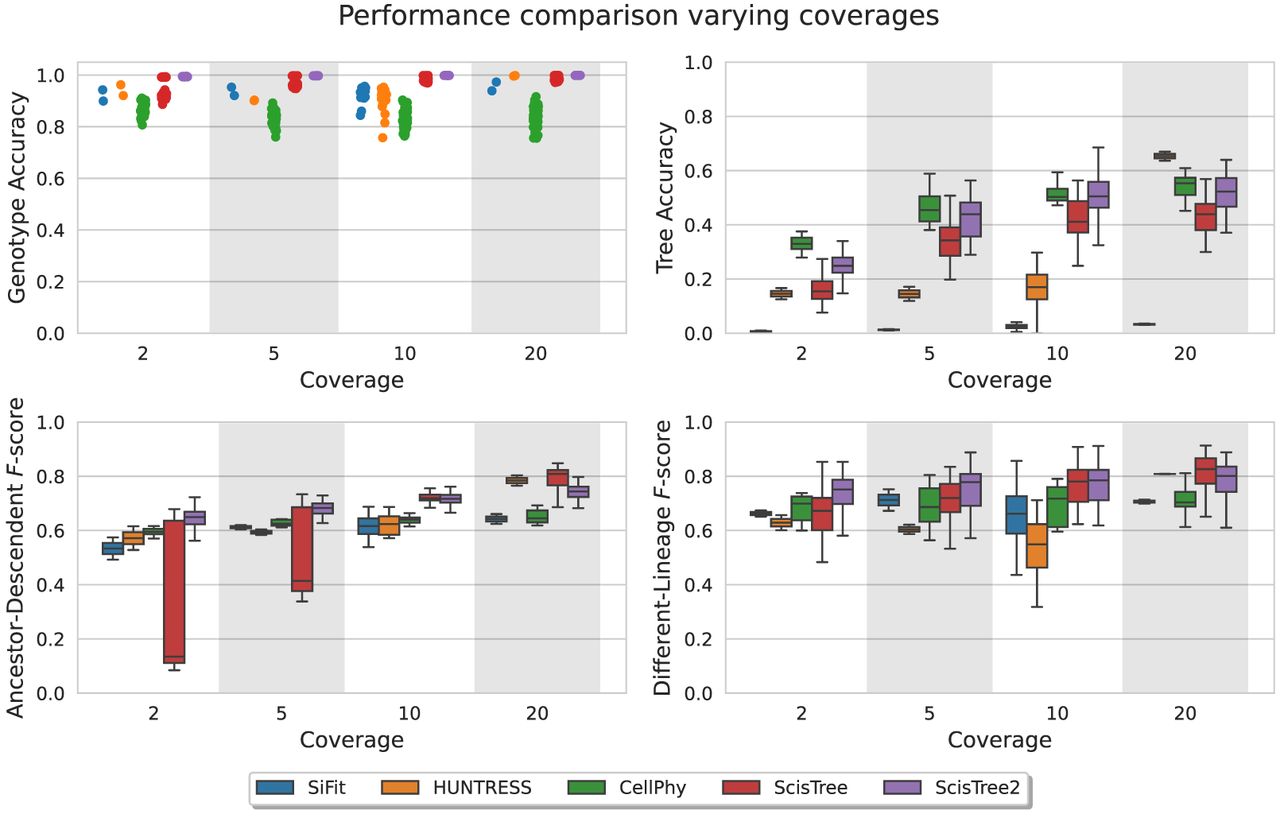
Figure 5.
Performance comparison on various coverage (per site per cell). x-axis: coverage at 2×, 5×, 10×, and 20×). y-axis: performance metric.
Performance comparison on various coverage (per site per cell). x-axis: coverage at 2×, 5×, 10×, and 20×). y-axis: performance metric.