Figure 4.
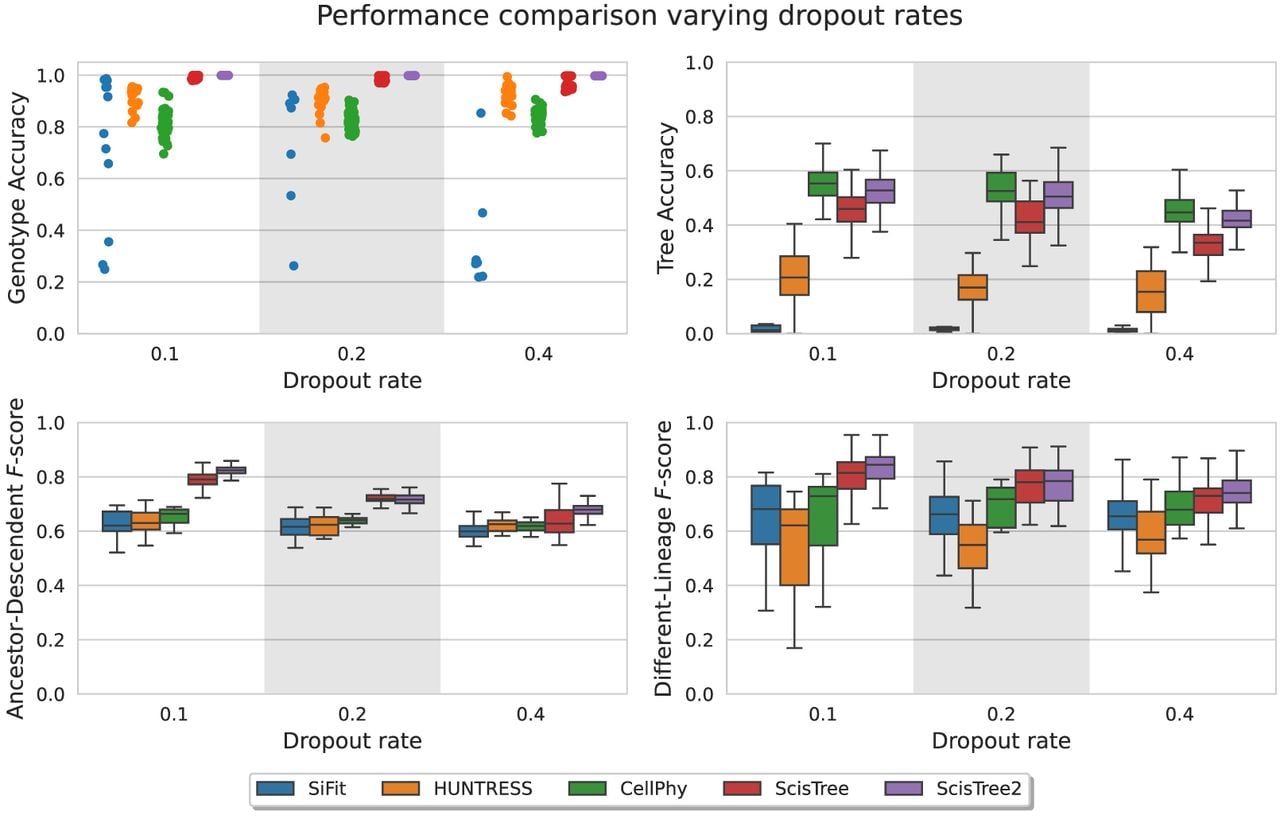
Performance comparison for ScisTree2 and four other methods on various dropout rates. x-axis: dropout rates at 0.1, 0.2, and 0.4. y-axis: performance metric.
Performance comparison for ScisTree2 and four other methods on various dropout rates. x-axis: dropout rates at 0.1, 0.2, and 0.4. y-axis: performance metric.