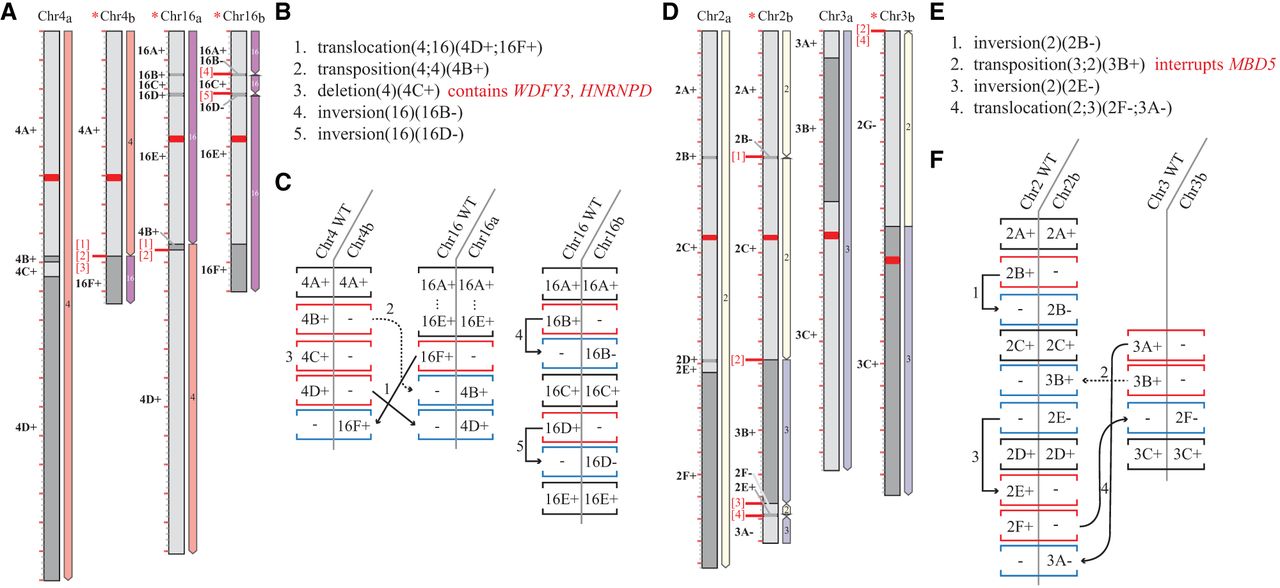
Figure 3.
OMKar reconstructions in two postnatal samples: 2280 (panels A–C) and 2281 (panels D–F). The karyograms (panels A, D) and the ISCN-formatted description (panels B, E; slightly altered for exposition) were automatically generated by OMKar. The karyograms displayed show the “segment view” for easier referencing. Panels C and F describe the SV interpretation process after path decomposition, with black brackets indicating concordant blocks, red indicating deletion blocks, and blue indicating insertion blocks.