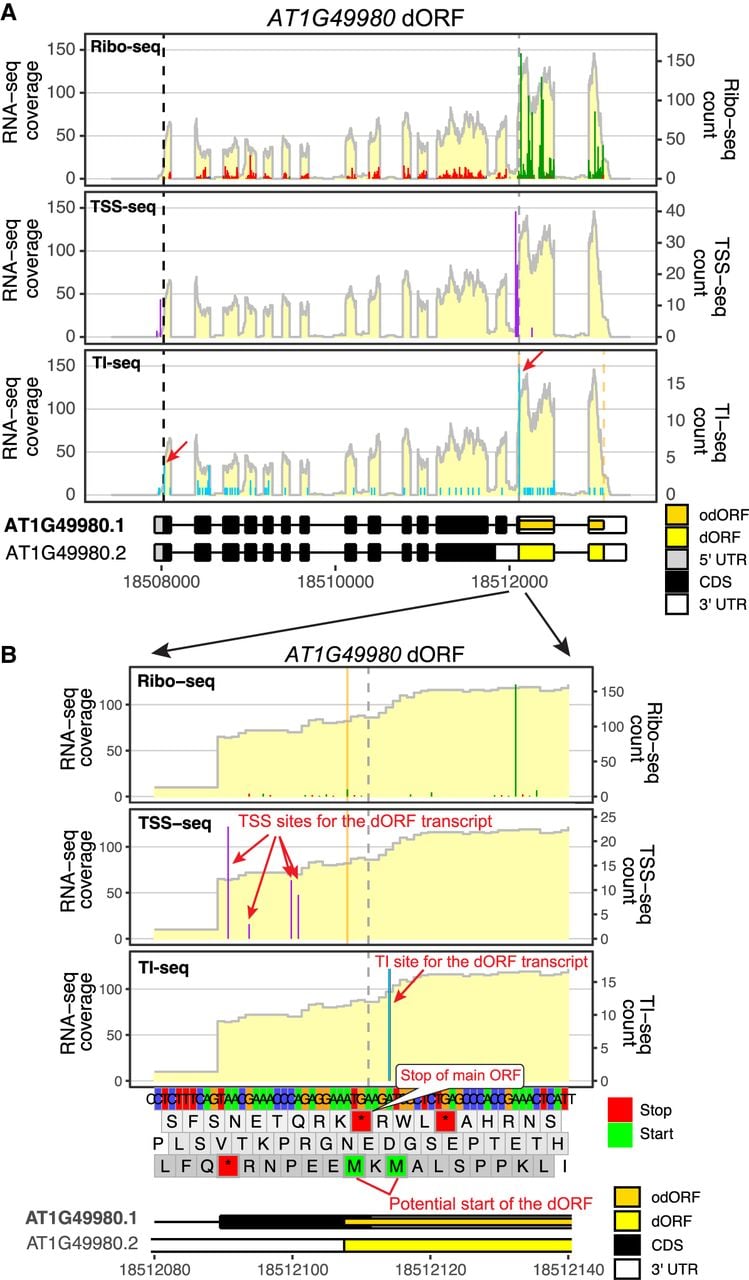
Multiomic comparison reveals the nature of a translated “dORF.” Ribo-seq and RNA-seq data are reported by Wu et al. (2024a); TSS-seq data are reported by Nielsen et al. (2019); and TI-seq data are reported by Willems et al. (2017). (A) A gene view showing Ribo-seq, TSS-seq, and TI-seq in parallel for AT1G49980; RNA-seq coverage is shown in the background for each panel. The Ribo-seq panel confirms a potential dORF translated in the 3′ UTR using frame 2 (green), which was previously identified by RiboTaper (Calviello et al. 2016). TSS-seq panel reveals two major TSS clusters (purple lines); one corresponds to the annotated TSS for AT1G49980, and the other is upstream of this dORF. The existence of a TSS upstream of the dORF supports this dORF arising from an unannotated gene/transcript, which has higher RNA levels than AT1G49980. (B) A zoomed-in view focusing on the 5′ of the dORF using the same data above. The gray vertical dashed line indicates the stop codon of the main ORF, and the orange solid line indicates the RiboTaper-predicted start codon for the dORF, which corresponds to the first of the two adjacent ATG starts (indicated by two methionine amino acids). The TI-seq data reveal that this dORF exclusively uses the second start codon, and therefore, this ORF does not overlap with the main ORF stop codon. Note that RiboTaper predicted this dORF to overlap with the main ORF of isoform 1 but not the main ORF of isoform 2. Therefore, in isoform 1, this dORF is considered an overlapping dORF (colored orange in the isoform 1 gene model), whereas in isoform 2, it is considered a distinct dORF (colored yellow in the isoform 2 gene model). The red arrows and comments were added in Adobe Illustrator.