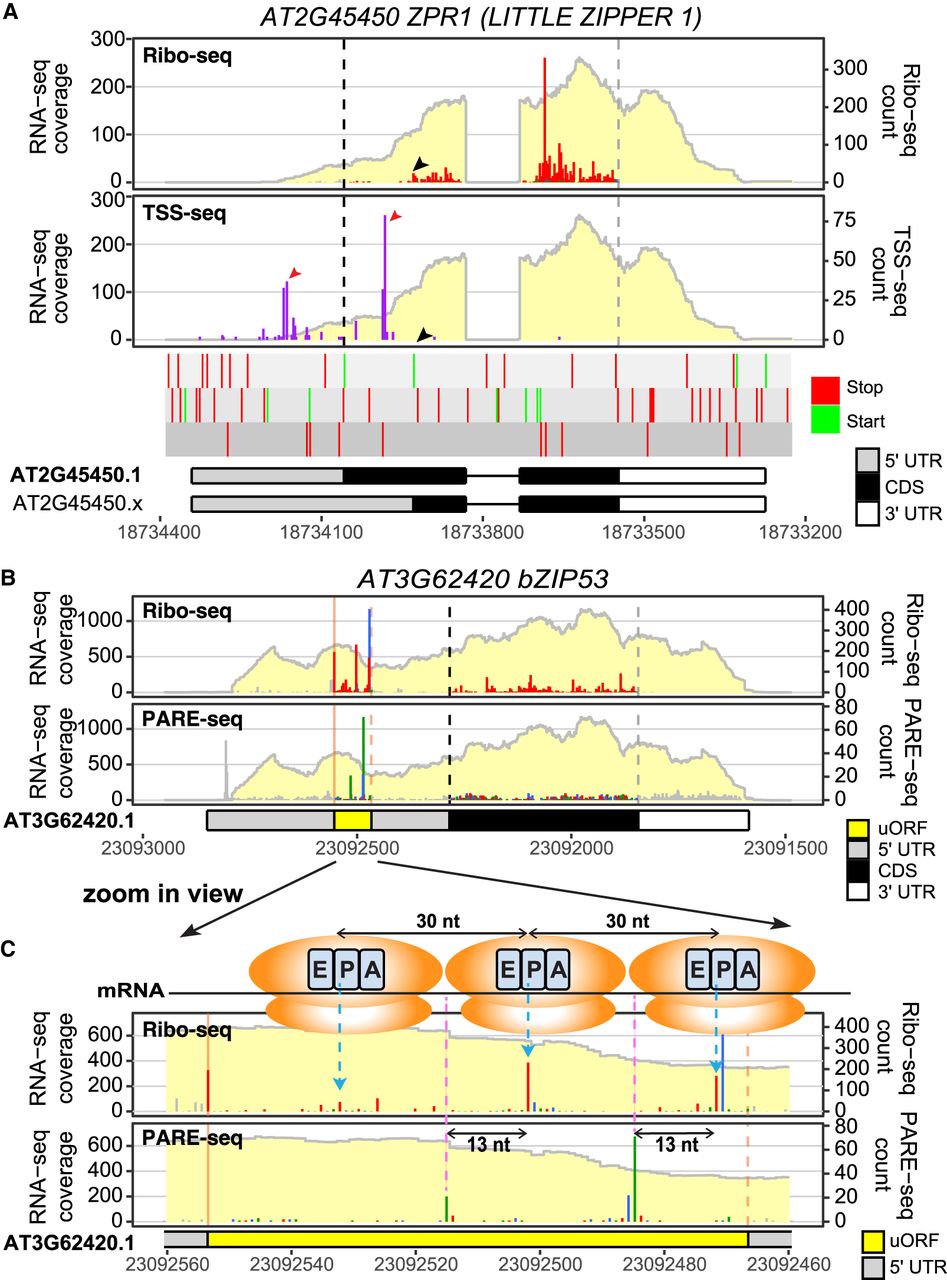
Multiomic comparisons reveal novel insights connecting the transcriptome, translatome, and degradome. (A) A gene view showing Ribo-seq/RNA-seq (Wu et al. 2024a) and TSS-seq (Nielsen et al. 2019) profiles for AT2G45450 LITTLE ZIPPER 1 (ZPR1). The Ribo-seq panel confirmed the translation of ZPR1, but the translation does not initiate at the annotated start codon (black dashed line); rather, reads mostly begin at the next in-frame AUG (black arrowhead in the Ribo-seq panel and start/stop codon track). TSS-seq (purple lines) reveals two major transcription start site (TSS) clusters (red arrowheads): one upstream of and one downstream from the annotated start codon. The downstream TSS cluster will cause the translation to start at the second AUG and result in the 93-aa peptide. The color for TSS-seq data can be modified using the sample_color parameter in ggRibo. (B) A gene view showing Ribo-seq/RNA-seq (Wu et al. 2024a) and PARE-seq (Nagarajan et al. 2019) in parallel for the bZIP53 gene; RNA-seq coverage is shown in a light-yellow background for each panel. The PARE-seq are also color-coded to compare the reading frame relationship with the Ribo-seq data. (C) A zoomed-in view of the conserved peptide uORF region. Accumulation of Ribo-seq reads at a 30 nt interval (highlighted by blue dashed arrows) upstream of the uORF stop codon (orange dashed line) suggests that multiple ribosomes stack in this region. Accumulation of the PARE-seq reads (highlighted by pink dashed lines) occurs at 13 nt upstream of the corresponding Ribo-seq peaks, supporting cotranslational mRNA decay in this region. The shift between the red/blue reading frames prior to the stop codon in Ribo-seq is also observed in PARE-seq (blue/green). Ribosomes, blue dashed arrows, and pink dashed lines were added in Adobe Illustrator.