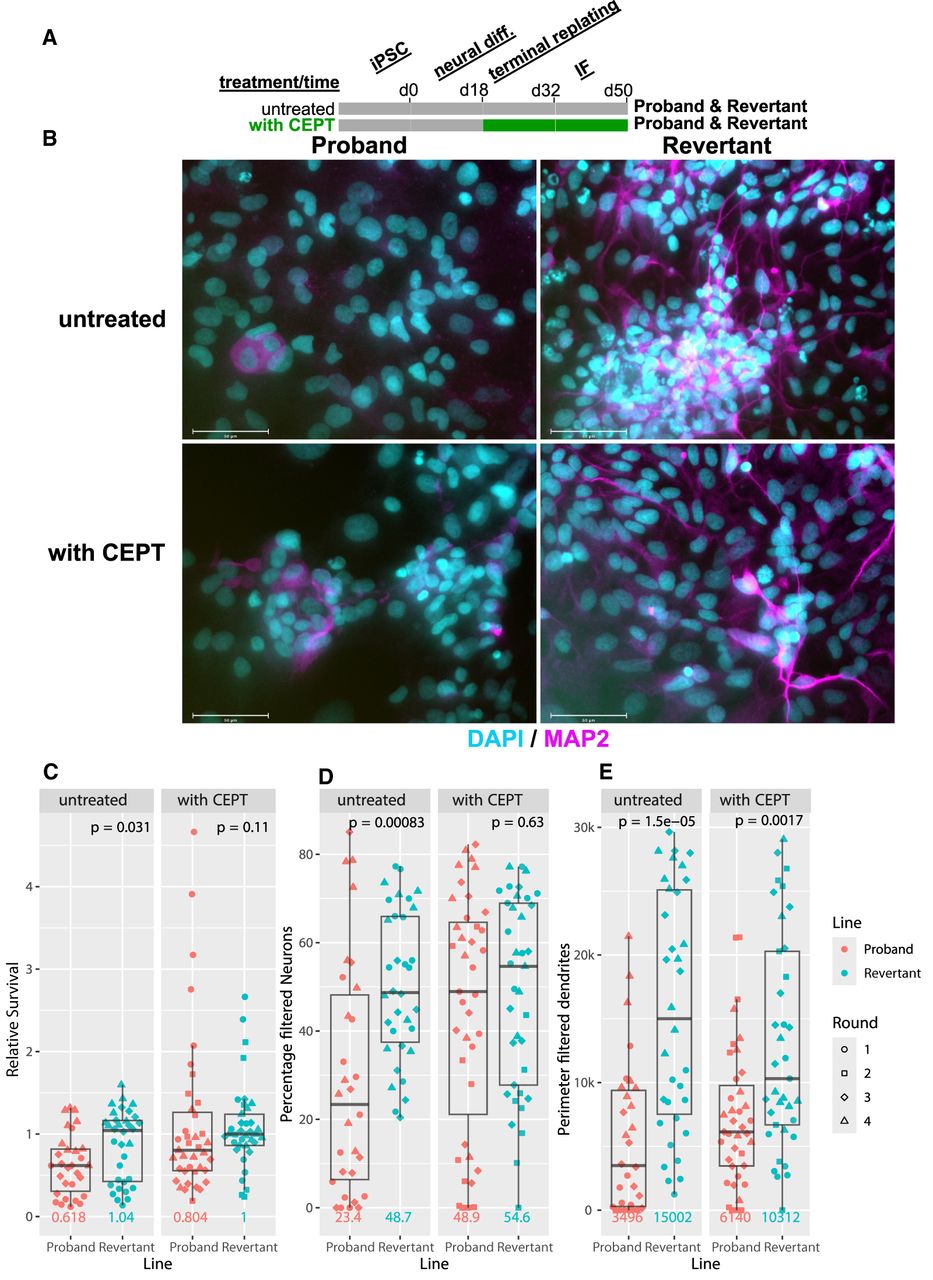
Analysis of neural differentiation (ND) in proband and revertant iPS cells. (A) Schematic of ND: Proband and revertant iPS cells were differentiated as previously described (Banda and Grabel 2016). On day 0 (d0) of ND, iPS media is replaced with N2B27 containing noggin (through d10). On d18, neural stem cells are terminally replated onto laminin-coated substrates and maintained in neural maturation media to the end point (d50). Following terminal replating, proband and revertant lines were cultured with (green) or without (gray) CEPT. (B) Representative immunofluorescence images for neuronal marker MAP2 (magenta), and nuclei (cyan) counterstained with Hoechst-33342 (scale bars, 100 µm). Proband (left) and revertant (right) neural cultures differ in MAP2+ prevalence and morphology, with the latter showing extensive outgrowths indicative of neuronal maturation. CEPT-treated neural cultures (bottom) show increased cell numbers and MAP2+ prevalence in the proband line relative to untreated proband cultures (top). (C) Relative cell survival was calculated by dividing the number of nuclei (range 40–700) per image (n = 9–14) by the median number of nuclei of the CEPT-treated revertant line in the corresponding round of differentiation. Colors denote proband and revertant lines; symbols distinguish four independent rounds of differentiation. P-values (two-tailed Wilcoxon rank-sum test) above revertant boxplots show the significance of median differences to the proband line, and medians are indicated below boxplots in their corresponding line color. (D) The percentage of filtered neurons was calculated as the fraction of MAP2+ nuclei over the sum of all nuclei in each image and multiplied by 100. Colors, symbols, P-value, and median as indicated as in C. (E) The perimeter of filtered dendrites is the total length of the perimeter of the MAP2+ cells filtered as in the work of Lickfett et al. (2022) and described in the Methods section. Colors, symbols, P-value, and median as indicated as in C.