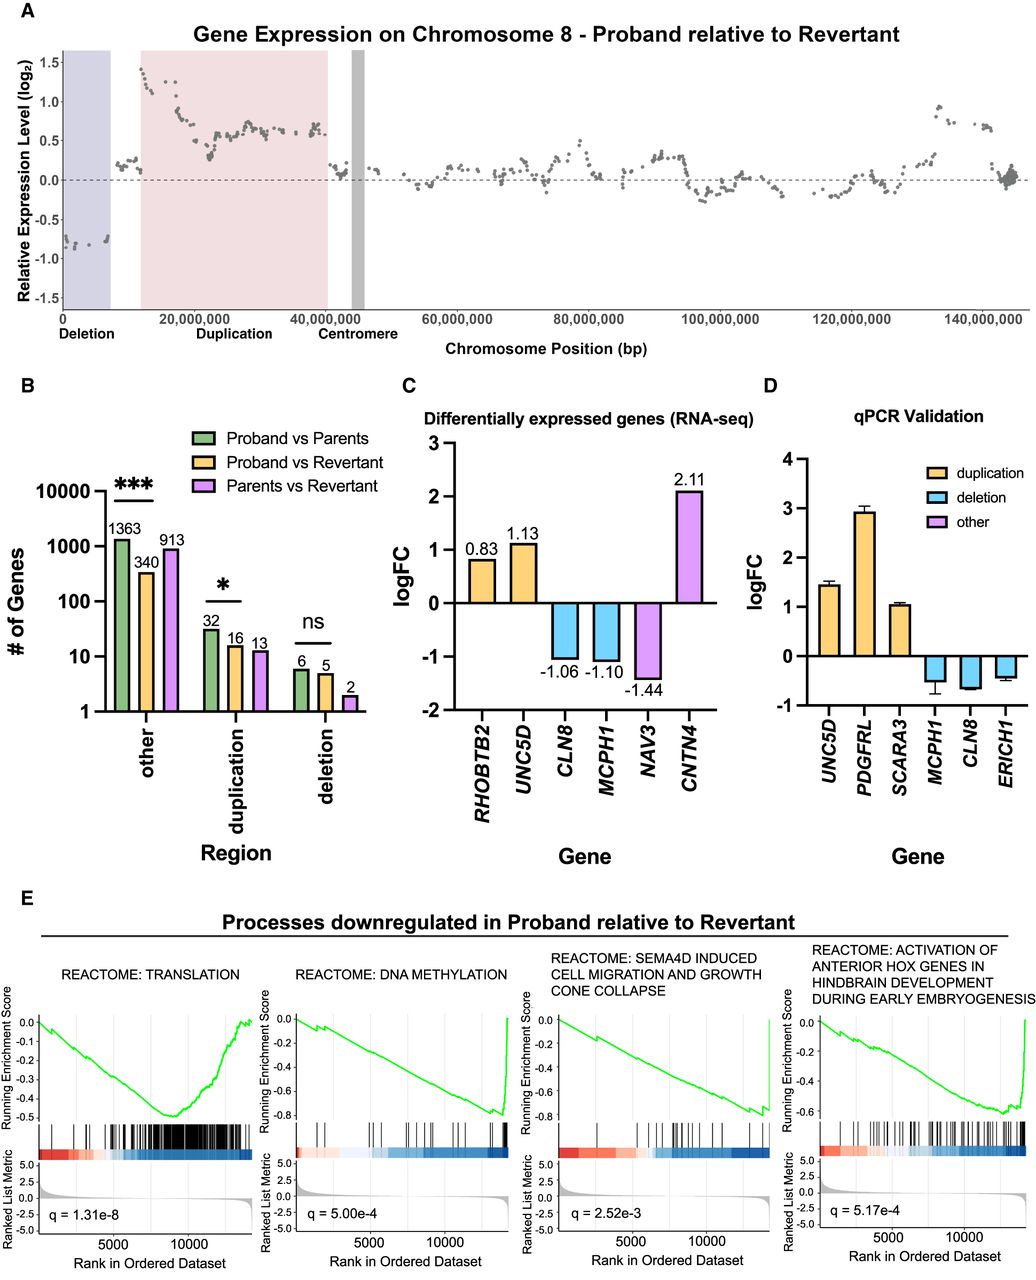
Comparing gene expression between proband and revertant iPS cells. (A) Diagram comparing relative gene expression versus chromosome position along Chromosome 8. The deleted region is highlighted in blue, the duplicated region is highlighted in red, and the position of the centromere is highlighted in gray. (B) Bar graph displaying the number of differentially expressed genes according to the chromosomal region. Statistical testing was performed via chi-squared test. (ns) P ≥ 0.05, (*) P ≤ 0.05, (**) P ≤ 0.01, (***) P ≤ 0.001. (C) Representative genes that were identified as differentially expressed between the proband and revertant iPS lines. A complete list of differentially expressed genes is included in Supplemental Table S1. (D) RT-qPCR validation of differentially expressed genes between proband and revertant iPS lines. Mean ± SEM; data from representative trials are shown (n ≥ 3 total trials). (E) Representative biological pathways enriched among genes that were downregulated in the proband relative to the revertant. A complete list of GSEA results is included in Supplemental Table S2.