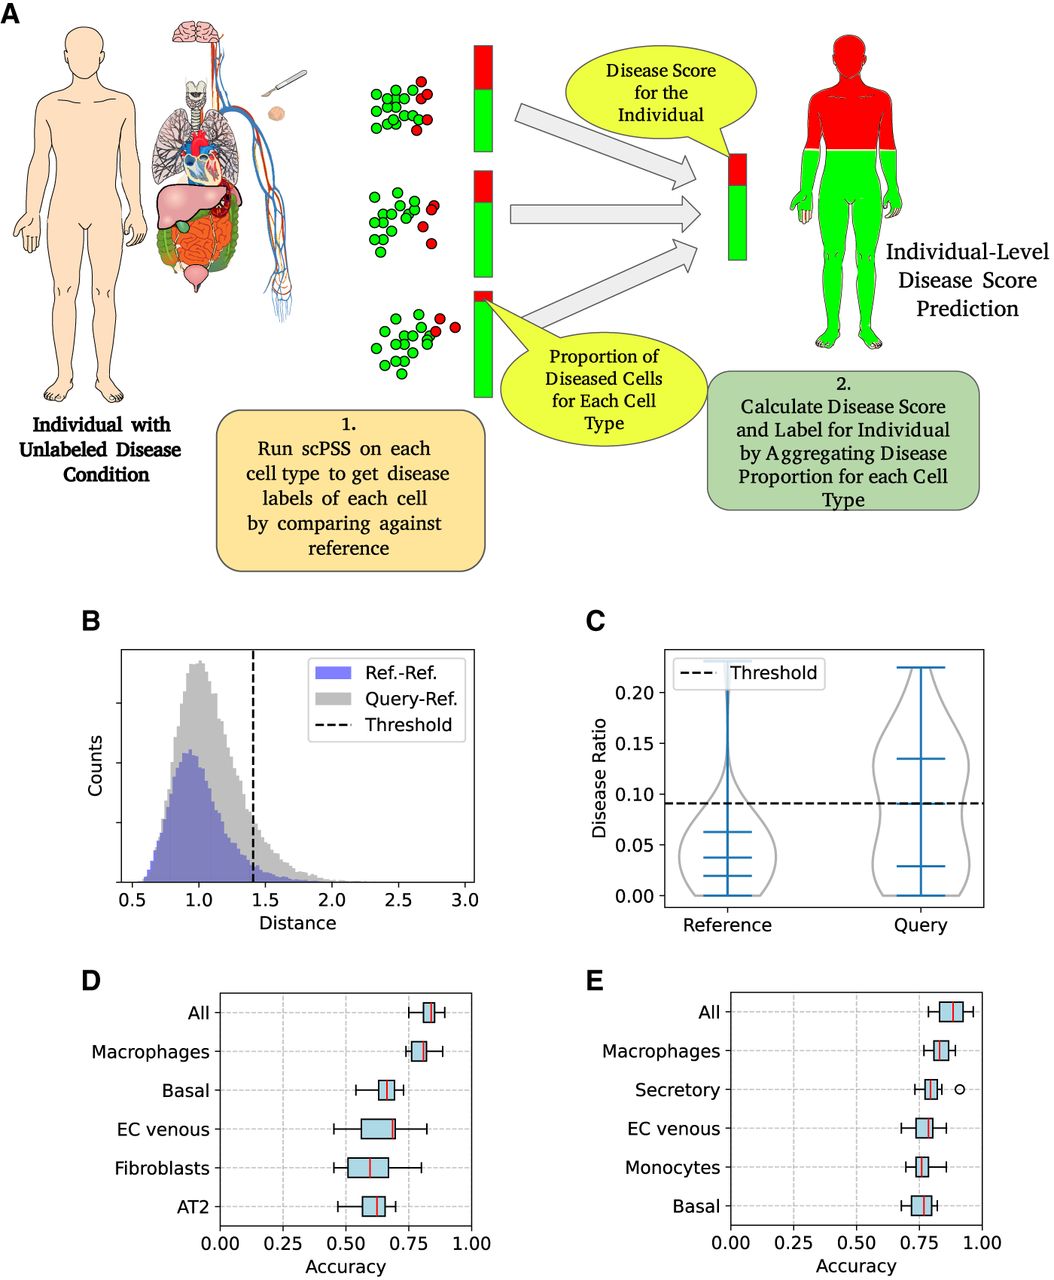
scPSS predicting healthy versus IPF. (A) Schematic diagram of predicting individual pathological condition using scPSS: At first, we find the pathological scores of each individual cell for the query individual by comparing against healthy references using scPSS on each individual cell type. Then, we aggregate these scores to get the individual's final pathological score. (Parts of the image have been adapted from SVG Human With All Organs.svg, which is under the CC BY-SA 3.0 license.) (B) Distance distribution of reference cells with reference cells and query cells with reference cells for the macrophage cell type in one example fold. (C) Violin plots of outlier ratios or disease ratios of reference and query individuals for the macrophage cell type in one example fold. (D) With only healthy cells present in the reference data set, the accuracy of scPSS pipeline at predicting healthy versus IPF condition of individuals based on the proportion of pathological cells of each cell group and all cells together. (E) With cells from both healthy and diseased individuals in the reference data set, we see an increase in predictive accuracy for the same experiment. (Note: For calculating accuracy for a certain cell type, we considered only the individuals with cells of that type.)