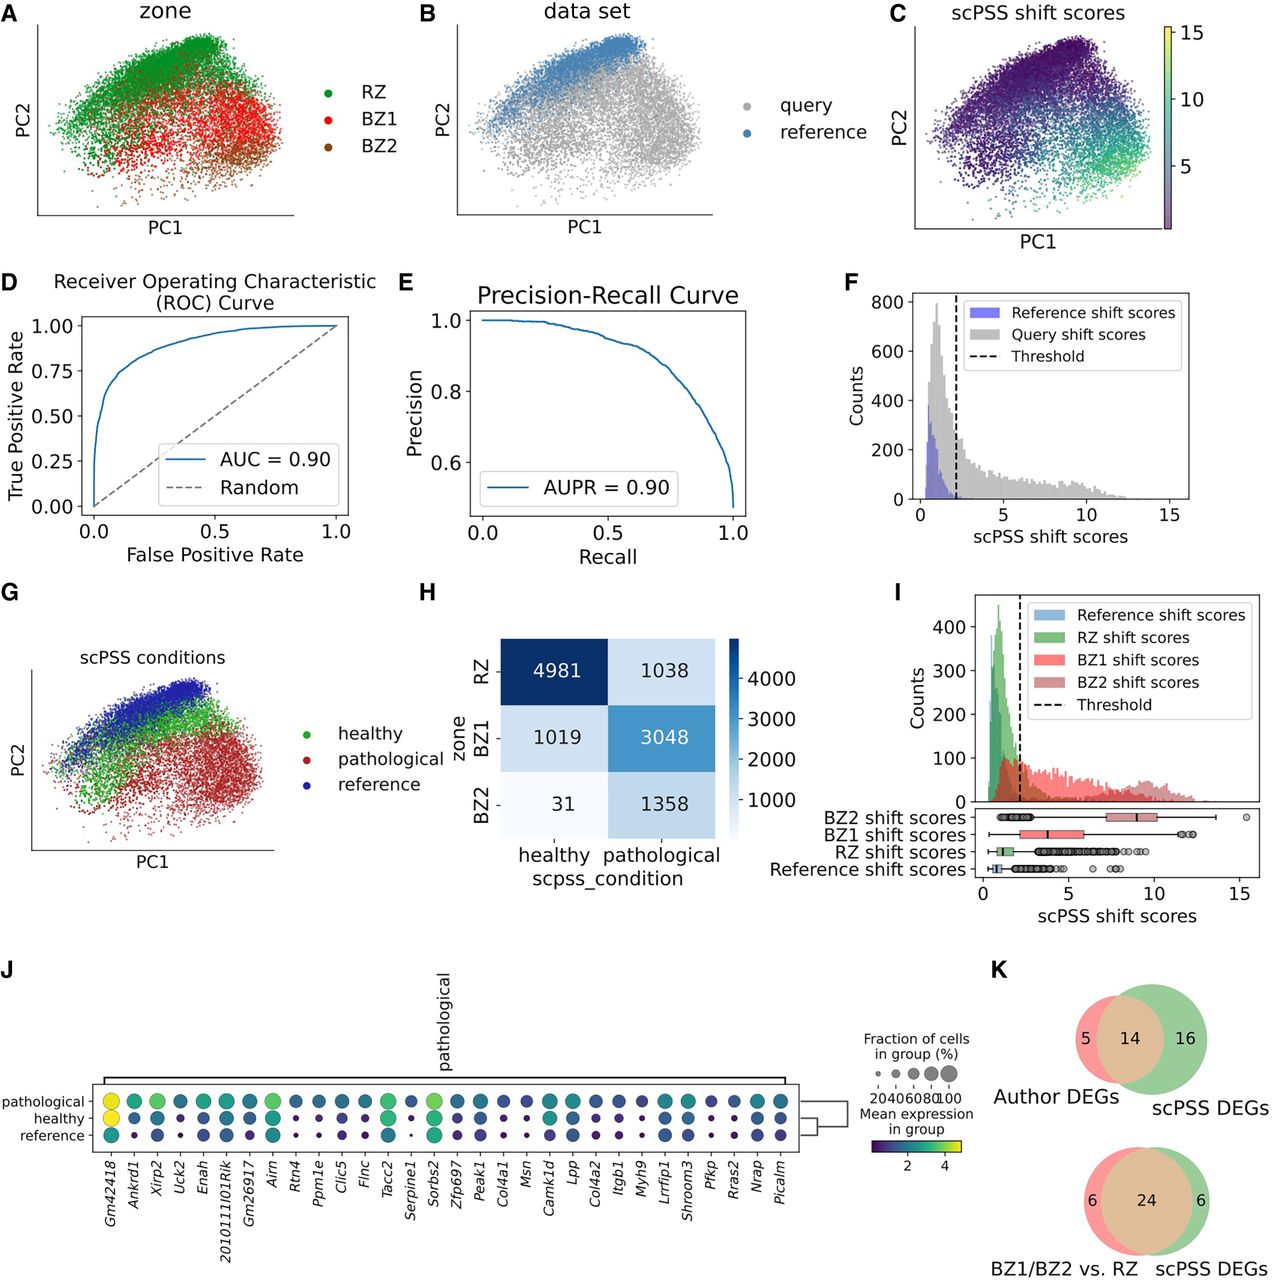
scPSS for damage progression in infarcted heart tissue. (A–C) The PC embeddings of all the cells from both healthy (before infarction) and query (after infarction), colored according to regions of nearness to infarcted regions (A), according to whether they belong to the reference or query data set (B), and the shift score assigned by scPSS (C). (D,E) The receiver operating characteristic (ROC) (D) and precision-recall (E) curves for the pathological scores provided by our method on the query data set. (F) Shift score distribution of reference cells with reference cells and query cells with reference cells. (G) The PC embeddings of all the cells from both healthy (before infarction) and query (after infarction), colored according to disease condition labels provided by scPSS. (H) The confusion matrix of the true labels and predicted labels given by scPSS framework on the query cells. (I) Shift score distribution of reference cells with reference cells and remote zone (RZ), border zone 1 (BZ1), and border zone 2 (BZ2) query cells with reference cells in histograms and box plots. (J) Top 30 differentially expressed genes across cells predicted pathological from query data set and reference cells. (K) The top Venn diagram shows the overlap between the DEGs reported by the original authors and those identified between predicted disease and reference cells using scPSS. The bottom Venn diagram shows the overlap between DEGs from the ground truth BZ1/2 versus RZ comparison and those from the predicted disease versus reference comparison.