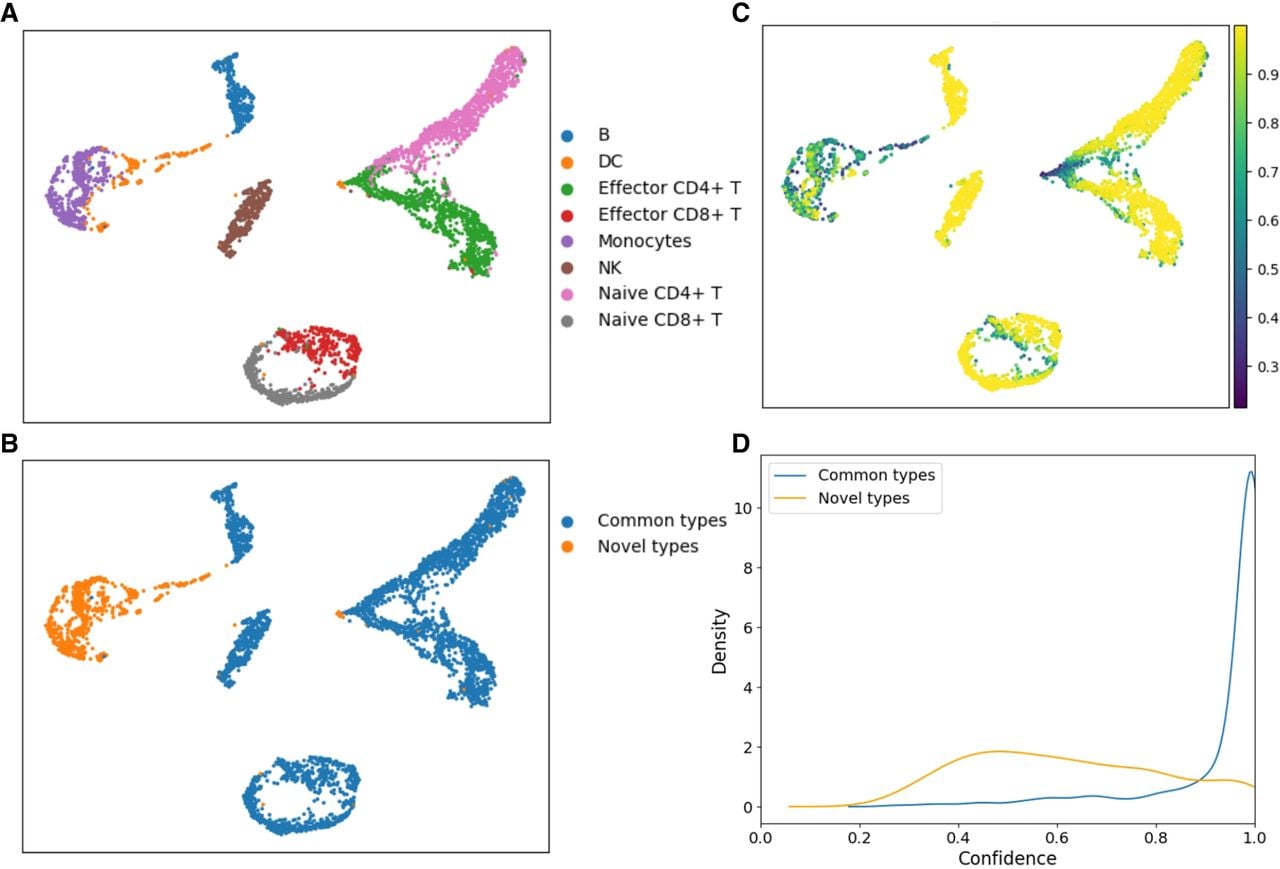
Figure 5.
Evaluation of novel cell-type discovery. (A) UMAP visualization of scATAC-seq cell embeddings generated by scSHEFT on the CITE-ASAP data set, with cells colored according to their cell type. (B) UMAP visualization of scATAC-seq cell embeddings generated by scSHEFT on the CITE-ASAP data set, with cells colored according to the common cell-type mask. (C) UMAP visualization of scATAC-seq cell embeddings generated by scSHEFT on the CITE-ASAP data set, with cells colored by prediction confidence score. (D) Kernel density estimation (KDE) plot showing the distribution of prediction probabilities for scATAC-seq cells, based on scSHEFT’s outputs.