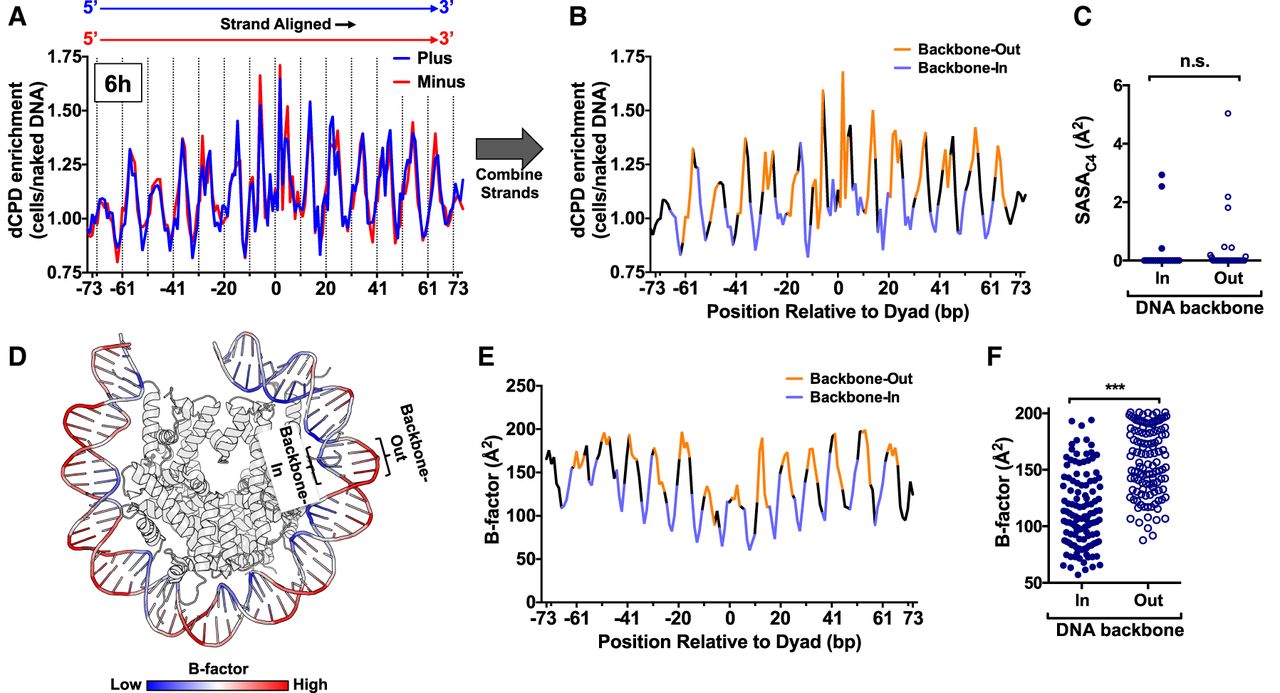
Structural analysis indicates that increased DNA mobility at DNA backbone-out positions promotes CPD deamination. (A) Strand-specific dCPD enrichment after 6 h deamination in cells relative to the in vitro control in about 10,000 strongly positioned nucleosomes. Data are the same as Figure 7A (top panel), except both DNA strands are aligned in the same 5′–3′ orientation. dCPD enrichment data for the plus strand is in blue and for the minus strand in red. Dashed lines indicate minor-out rotational settings. (B) Same as panel A, except showing the aggregate dCPD enrichment of both DNA strands each aligned in the 5′–3′ orientation. DNA backbone-out positions are colored orange, and backbone-in positions are in light purple. Intermediate positions are in black. (C) Quantification of the C4 solvent accessible surface area (SASAC4) for cytosine bases in the yeast nucleosome structure (PDB ID: 1ID3) for bases at minor-in or minor-out rotational settings. (n.s.) Not significant, P > 0.05 based on a Mann–Whitney U test. (D) Visualization of the DNA backbone B-factor for the yeast nucleosome structure (White et al. 2001). Higher B-factors are colored red and lower B-factors in blue. Image generated using PyMOL. (E) Quantification of DNA backbone B-factors calculated from the yeast nucleosome structure (PDB ID: 1ID4). Both DNA strands were aligned in the 5′–3′ orientation, and the B-factor values for both strands were averaged. DNA backbone-out positions are colored orange, backbone-in positions are in light purple, and intermediate positions are in black. (F) Plot of average DNA backbone B-factors calculated from the yeast nucleosome structure (PDB ID: 1ID4) for DNA backbone-in and backbone-out positions. (***) P < 0.0001 based on a Mann–Whitney U test.