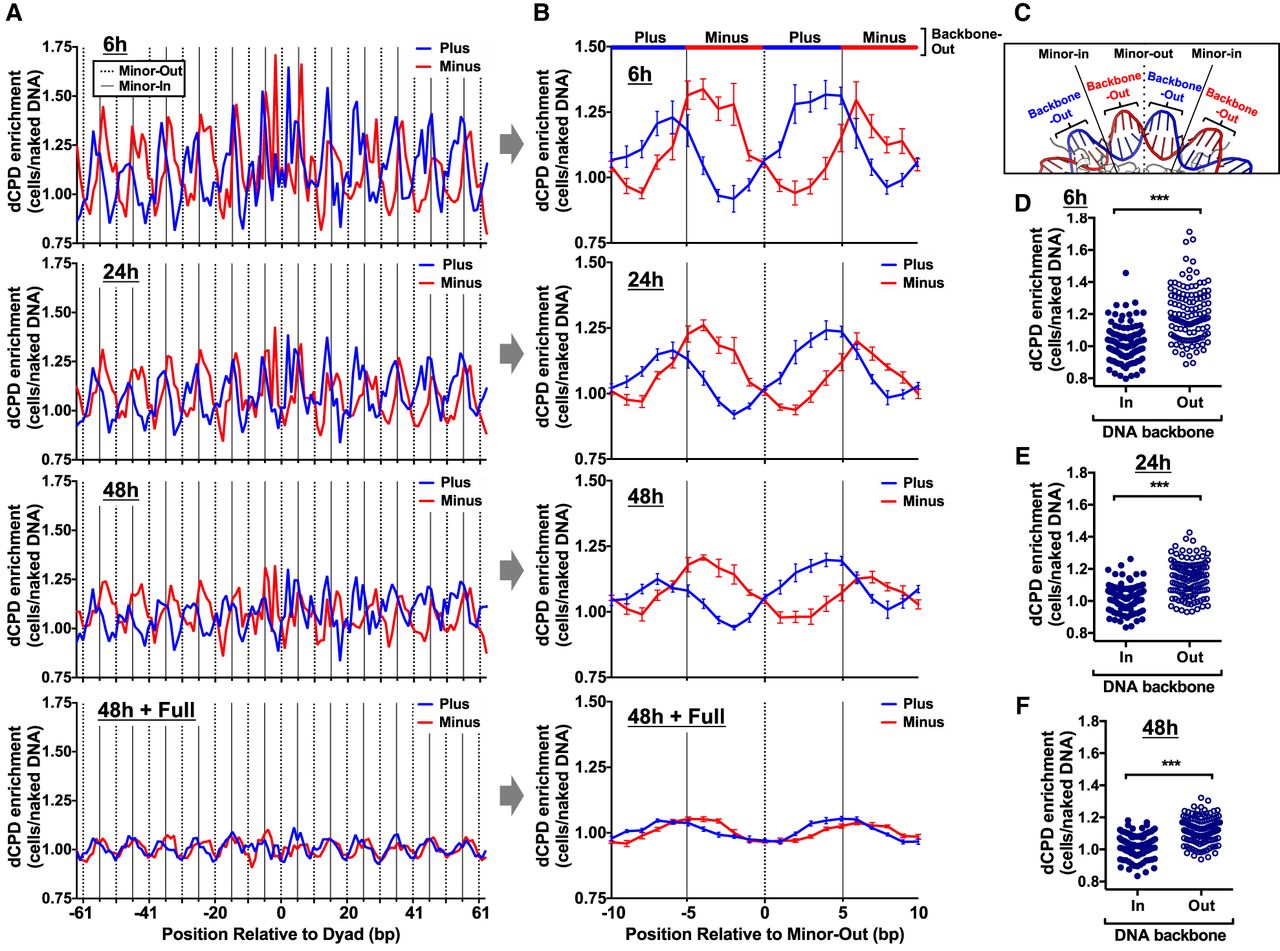
CPD deamination is elevated at DNA backbone-out positions and suppressed at backbone-in positions in nucleosomes. (A) Strand-specific dCPD enrichment in UV-irradiated cells relative to the in vitro deamination control is plotted at each position relative to the central dyad of about 10,000 strongly positioned nucleosomes. dCPD enrichment data are plotted for the indicated deamination time points. Dashed lines indicate minor-out rotational settings, and solid lines depict minor-in rotational settings. The mean and SEM depicted for the plus strand is in blue and minus strand in red. Nucleosome positioning data are from Brogaard et al. (2012). (B) Same as panel A, except showing strand-specific average dCPD enrichment for the 10 bp flanking minor-out rotational settings. Dashed line indicates minor-out, and solid lines indicate flanking minor-in positions. The alternating red and blue colored line at the top of the panel indicates which DNA strand is backbone-out (i.e., blue indicates the plus strand is backbone-out, and red indicates the minus strand is backbone-out) at that position in the nucleosome structure. dCPD enrichment is averaged across all minor-out rotational settings in panel A. (C) Portion of the yeast nucleosome structure (1ID3) highlighting the locations of the minor-in and minor-out rotation settings and DNA backbone-out and backbone-in positions. The plus strand is colored blue and the minus strand red. Image generated using PyMOL. (D–F) Plot of dCPD enrichment at DNA backbone-in and backbone-out rotational settings in about 10,000 strongly positioned nucleosomes for 6 h (D), 24 h (E), and 48 h (F) deamination samples. (***) P < 0.0001 based on a Mann–Whitney U test.