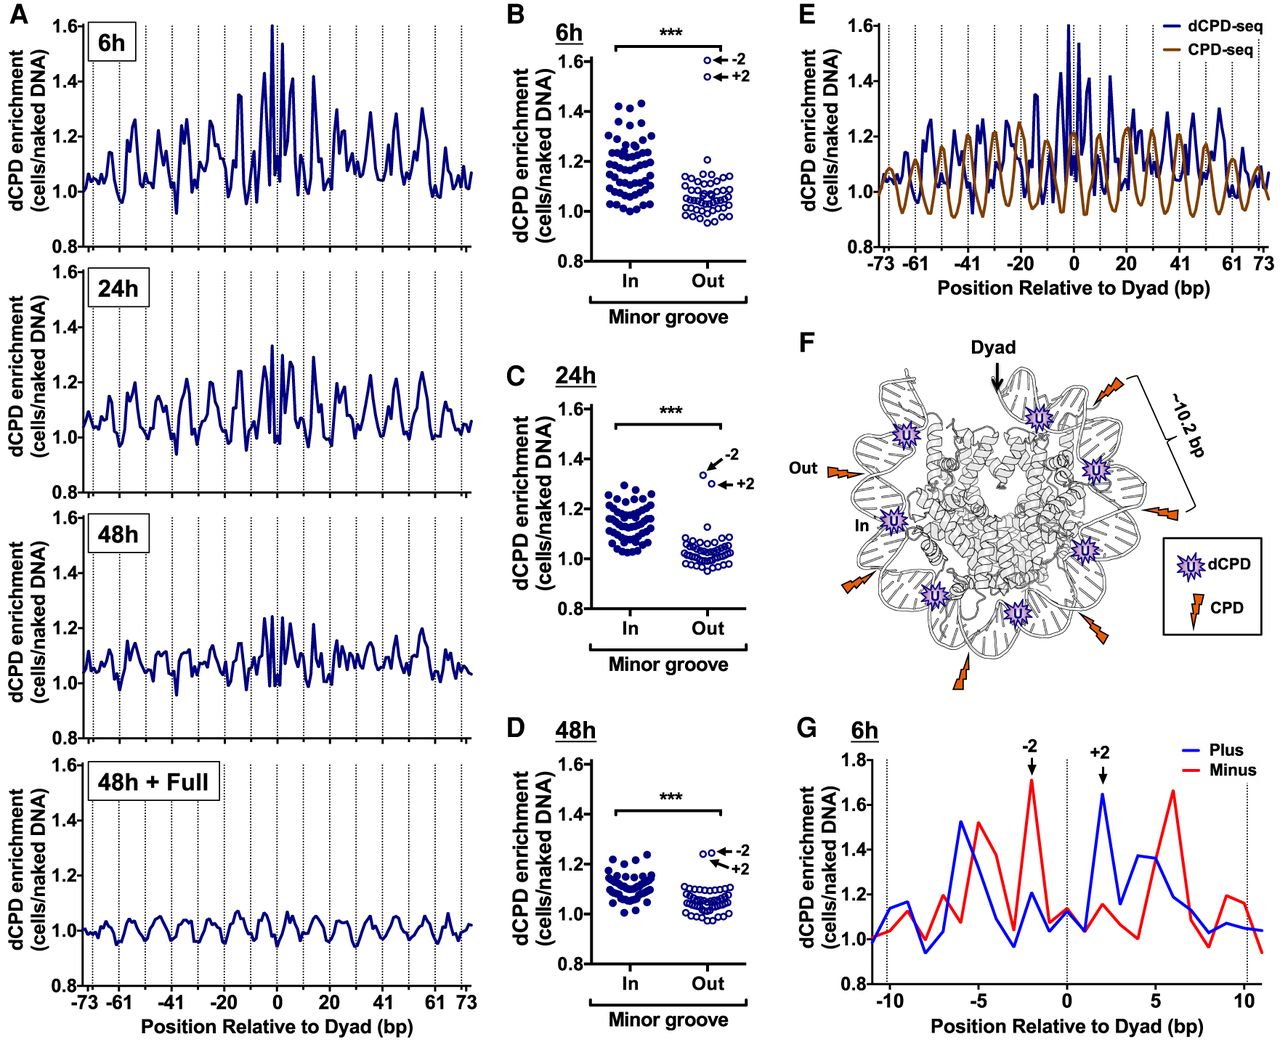
CPD deamination is elevated at minor-in rotational settings and suppressed at minor-out rotational settings in nucleosomes. (A) dCPD enrichment in UV-irradiated cells relative to the in vitro deamination control is plotted at each position relative to the central dyad of about 10,000 strongly positioned nucleosomes for the indicated deamination time points. Dashed lines indicate minor-out rotational settings. Nucleosome positioning data are from Brogaard et al. (2012). (B–D) Plot of dCPD enrichment at minor-in and minor-out rotational settings for 6 h (B), 24 h (C), and 48 h (D) deamination samples. (***) P < 0.0001 based on a Mann–Whitney U test. (E) Comparison of dCPD (6 h time point) and CPD (0 h, immediately following damage) enrichment in strongly positioned yeast nucleosomes. Dashed lines indicate minor-out rotational settings. CPD enrichment was calculated relative to a UV-irradiated naked DNA control and is from Mao et al. (2016). (F) Model showing structure of the yeast nucleosome (PDB ID: 1ID3) (White et al. 2001) and highlighting locations of elevated CPD enrichment (orange lightning bolts) and dCPD enrichment (purple U [uracil]). CPD enrichment is elevated at minor-out positions, but CPD deamination is elevated at minor-in positions in nucleosomes. Only one DNA gyre is shown. Image generated using PyMOL. (G) Close-up of strand-specific dCPD enrichment in UV-irradiated cells following 6 h deamination relative to the in vitro deamination control. dCPD enrichment is depicted for nucleosome positions within 11 bp of the central dyad of about 10,000 strongly positioned nucleosomes.