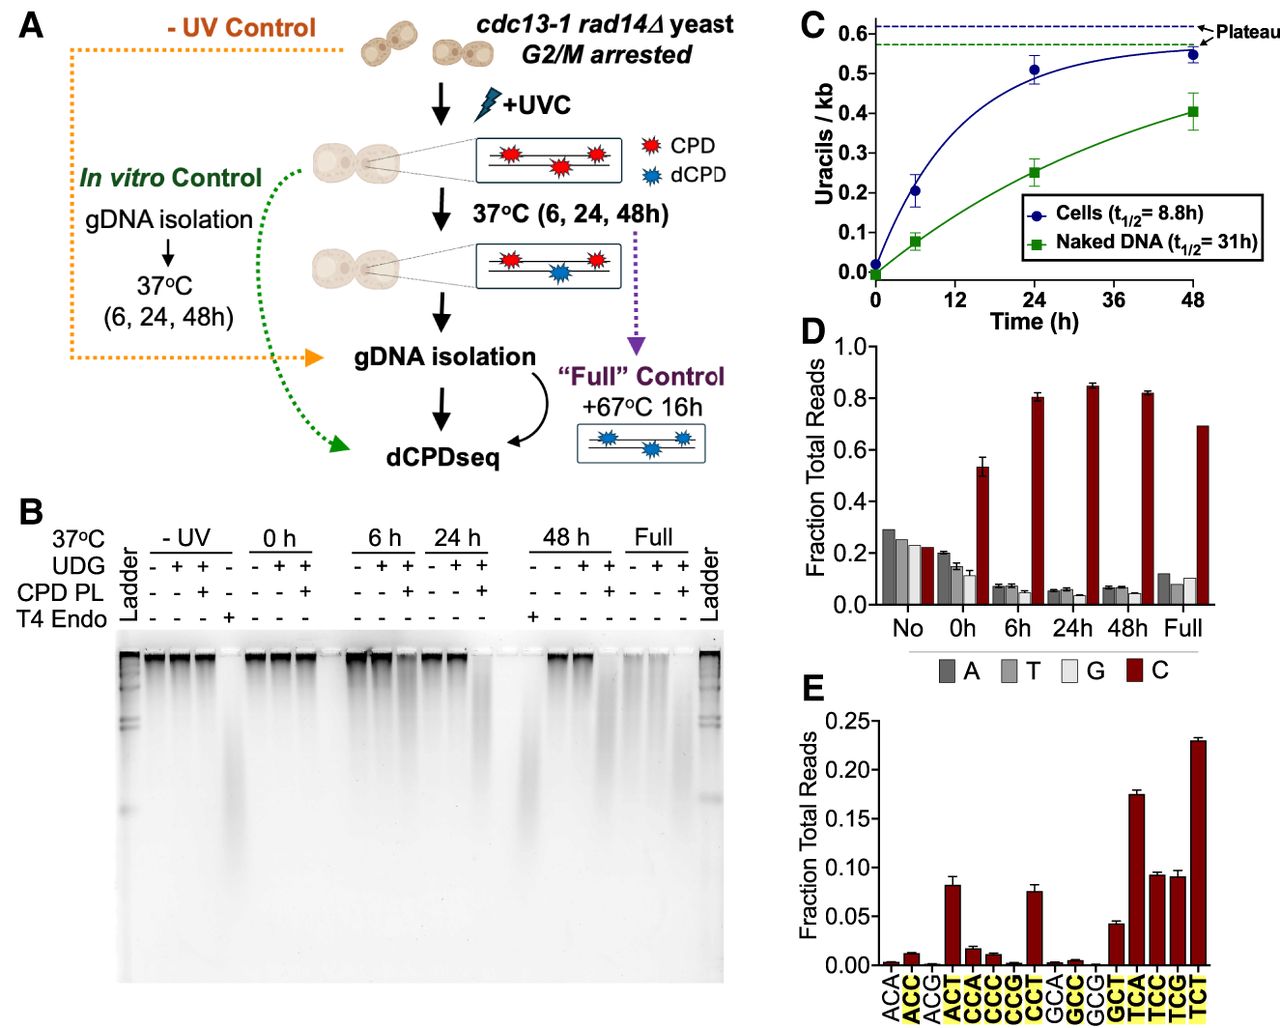
Analysis of dCPD formation in UV-irradiated, NER-deficient cells. (A) Schematic of cellular deamination experimental design. Arrested rad14Δ cdc13-1 yeasts were irradiated with ∼600 J/m2 UVC and incubated in water at 37°C to maintain arrest and allow deamination to occur. At each time point, cells were harvested and their gDNA extracted for use in library preparation or alkaline gel electrophoresis assay. To create a fully deaminated control, isolated gDNA from the 48 h time point was further incubated for 16 h at 67°C. In vitro control libraries were prepared by isolating genomic DNA from irradiated rad14Δ cdc13-1 yeast and incubating the genomic DNA at 37°C in vitro for the same time points in a thermocycler. (B) Representative alkaline gel of CPD deamination experiment performed in cells. (C) Quantification of uracils detected via alkaline gel electrophoresis for cellular and in vitro (control) deamination samples. The number of uracils per kilobase represents averages of three independent experiments after subtracting background signal from the UDG-alone digest. Mean ± SEM is depicted. Solid lines indicate the single exponential fit to the cellular and in vitro deamination data. The calculated half-life (t1/2) from each single exponential fit is listed, and the calculated asymptotic plateau values are indicated as dashed lines. In vitro DNA deamination data are the same as in Figure 1C. (D) dCPD-seq libraries prepared from cellular deamination experiments are strongly enriched for reads mapping to cytosine bases (red bars) for each time point. Data depict mean and SEM values from three independent replicates of the 6 h, 24 h, and 48 h time points; two replicates of the 0 h time point; and a single replicate for the no UV and full deamination time points. (E) dCPD-seq reads mapping to cytosines occur almost exclusively in dipyrimidine sequence contexts (shown in bold text with yellow highlighting). Graph shows mean and SEM values from three independent replicates of the 24 h time point.