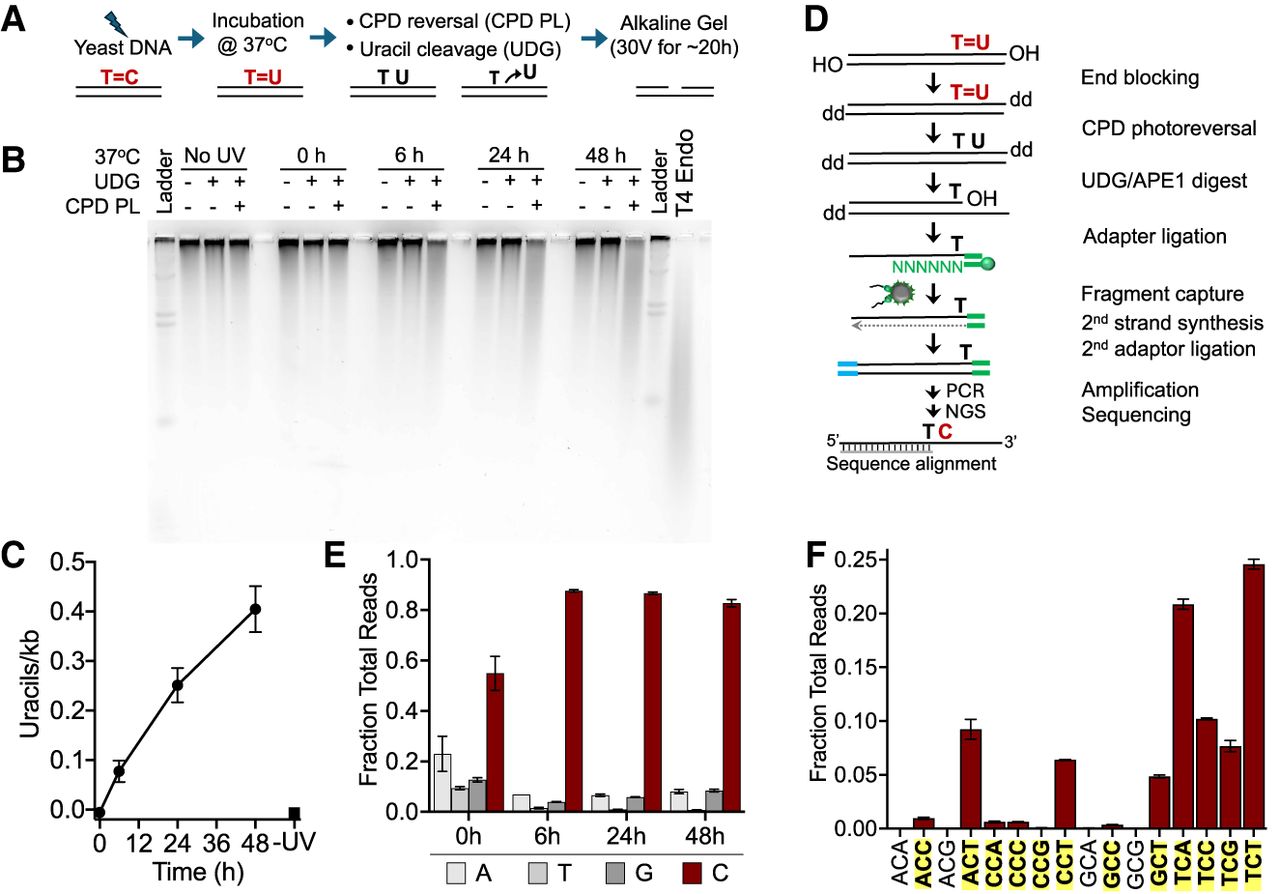
Analysis of deaminated CPDs (dCPDs) in yeast genomic DNA that was UV-irradiated and deaminated in vitro. (A) Schematic of the process for quantifying dCPD formation via alkaline gel electrophoresis. Details are available in the Methods. (B) Representative SYBR gold–stained alkaline gel showing dCPD levels in UV-irradiated (∼600 J/m2 of UVC) yeast genomic DNA at different deamination time points. Control experiments with UDG alone were performed to assess background uracil levels. Irradiated DNA was also independently digested with T4 endonuclease V to confirm UV-induced CPD formation. (C) Quantification of alkaline gel electrophoresis results from three independent replicate experiments. Mean ± SEM is depicted. (D) Schematic of the dCPD-seq method for detecting deamination of CPDs at single-nucleotide resolution. CPDs are reversed with CPD PL, and genomic uracils are excised with UDG and APE1. Sequencing reads are expected to map adjacent to cytosine bases in dipyrimidine contexts. (E) Graph depicting the fraction of total reads mapping immediately upstream of each DNA base in the saccer3 reference genome. dCPD-seq reads map primarily to cytosine bases (red bars) for each deamination time point. Mean and SEM for two independent replicate experiments are depicted for each time point. (F) dCPD-seq reads predominantly map to cytosines in dipyrimidine contexts (bold, yellow background). Graph depicts mean and SEM results for two independent replicates of the 24 h time point.