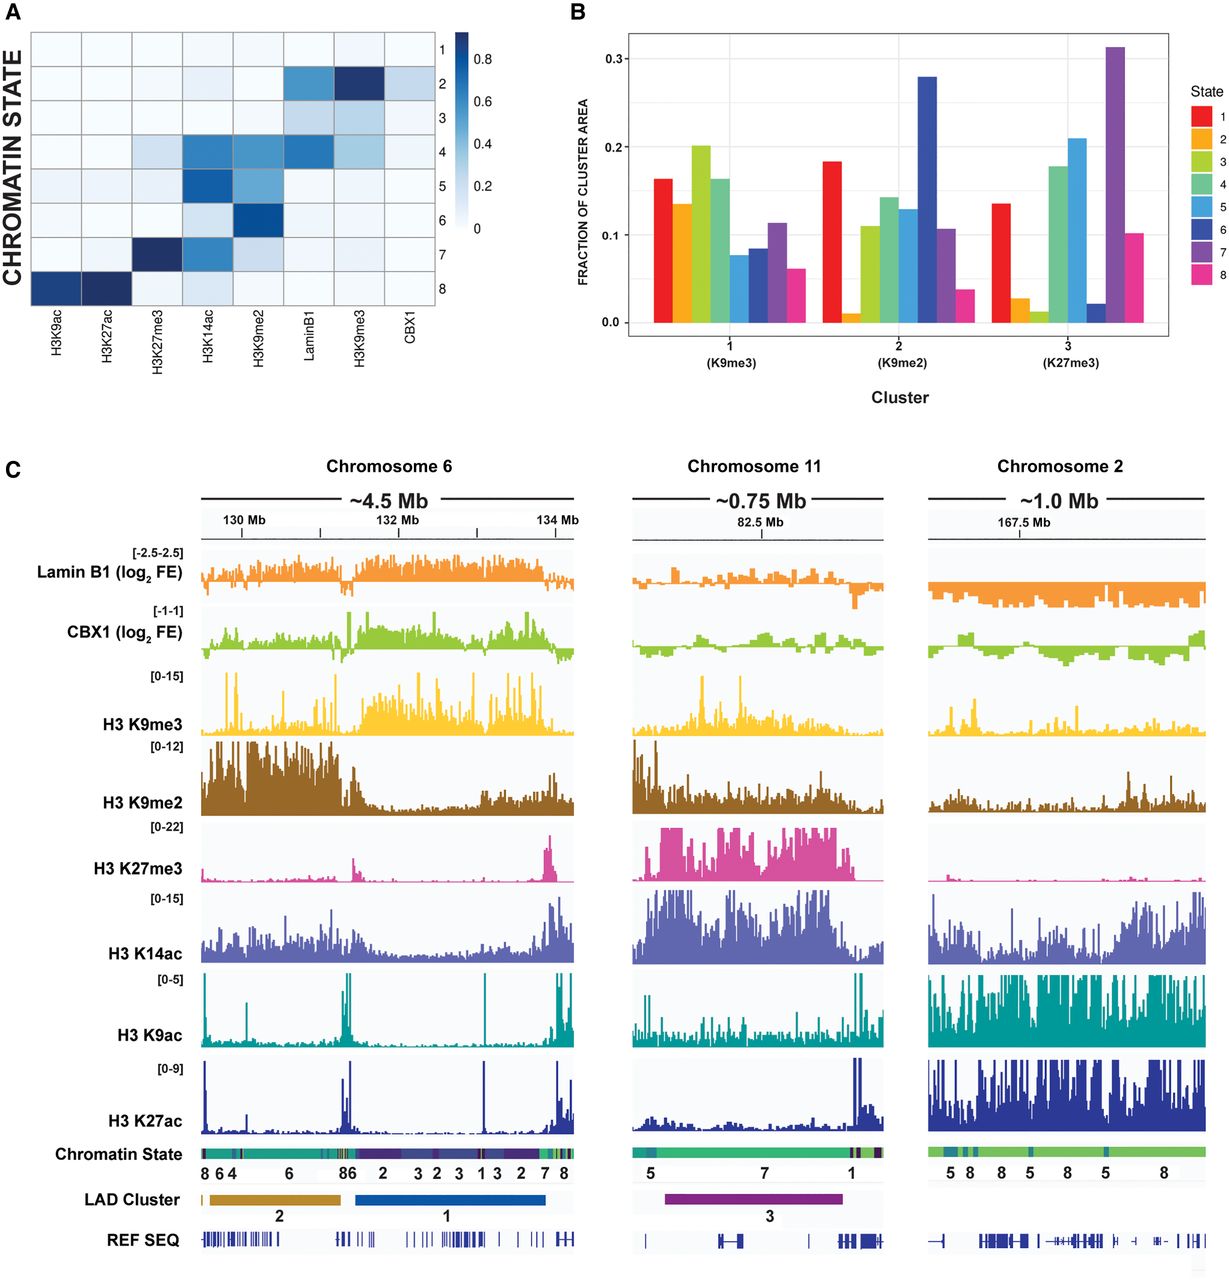
Figure 6.
ChromHMM analysis and comparison with LAD clusters. (A) Heat map of feature probabilities in each state. Color intensity represents feature abundance in that state. ChromHMM was run with eight states using 10-kb bins. (B) Relative abundance of each state in Cluster 1 (K9me3 LADs), Cluster 2 (K9me2 LADs), and Cluster 3 (K27me3 LADs). Height of bars represents the fraction of 10-kb bins within that LAD cluster that correspond to that state. (C) IGV browser view showing example LADs from each cluster as well as a representative inter-LAD region, with the distribution of ChromHMM states across each (e.g., enrichment of states 4–6 in K9me2 LADs, states 1–3 in K9me3 LADs, and state 7 in K27me3 LADs).