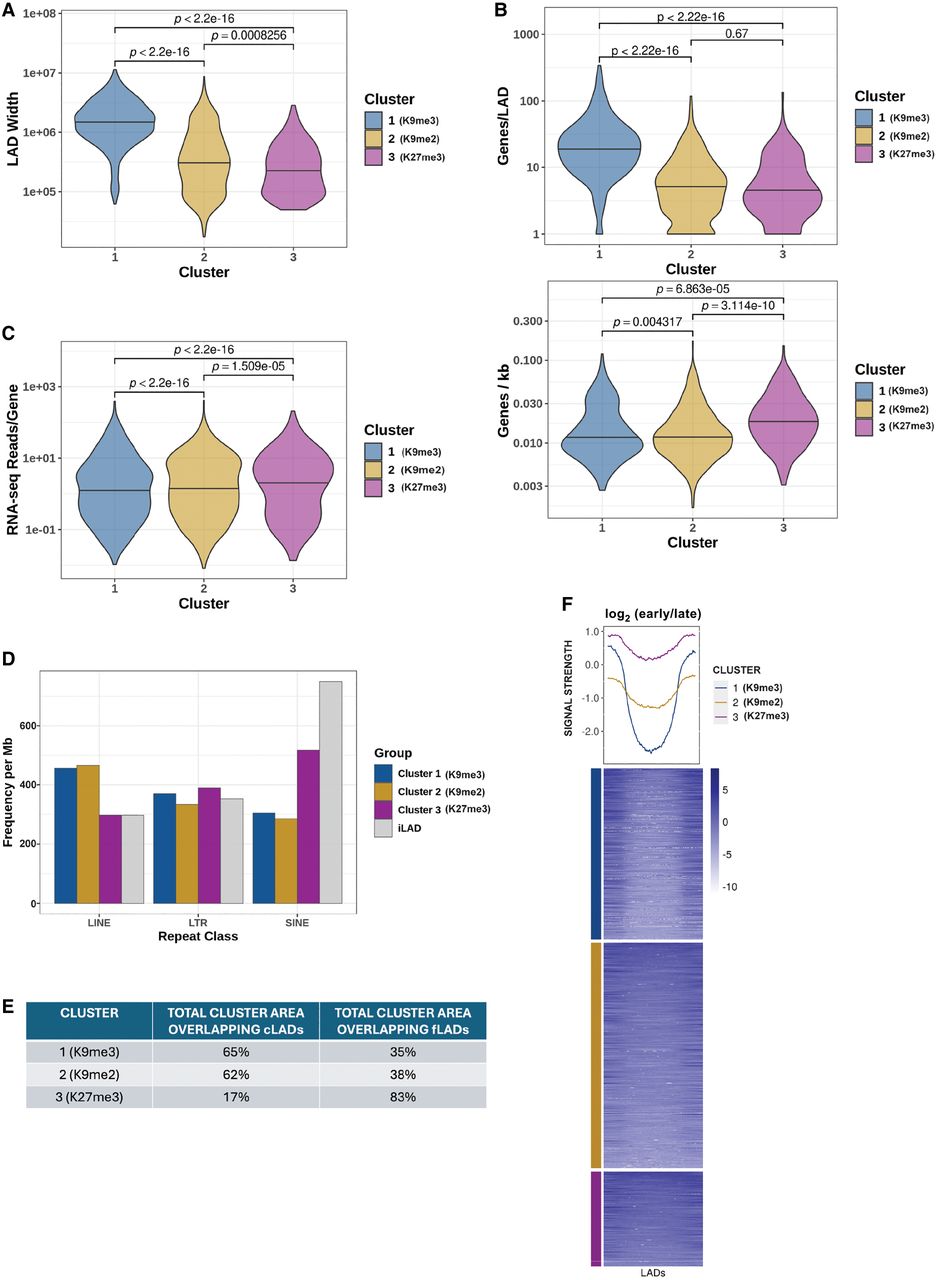
Comparison of K9me3 LADs, K9me2 LADs, and K27me3 LADs. (A) Comparison of LAD sizes (bp) between clusters. P-values determined by Wilcoxon rank-sum test. (B) Gene content in each cluster, represented by total number of genes contained in LADs from each cluster (top) and gene density in each cluster (bottom). (C) Gene expression from LADs of each cluster in fragments per kilobase per million (FPKM). P-values determined by Wilcoxon rank-sum test. (D) Abundance of LINE elements, SINE elements, and LTR repeats in each cluster compared to inter-LADs. (E) Table showing overlap between each cluster and cLADs. The cLADs set used came from a previously study which mapped LADs by DamID in several cell types (Peric-Hupkes et al. 2010). The total cLAD area overlapping our clusters does not add up to 100% because a small fraction of the LADs detected in those cells were not detected in our LAD mapping that gave rise to the clusters. (F) Heat map and profile of replication colored by LAD clusters. Values represent log2 early/late signal, so low values indicate late replication timing and higher values represent earlier replication timing.