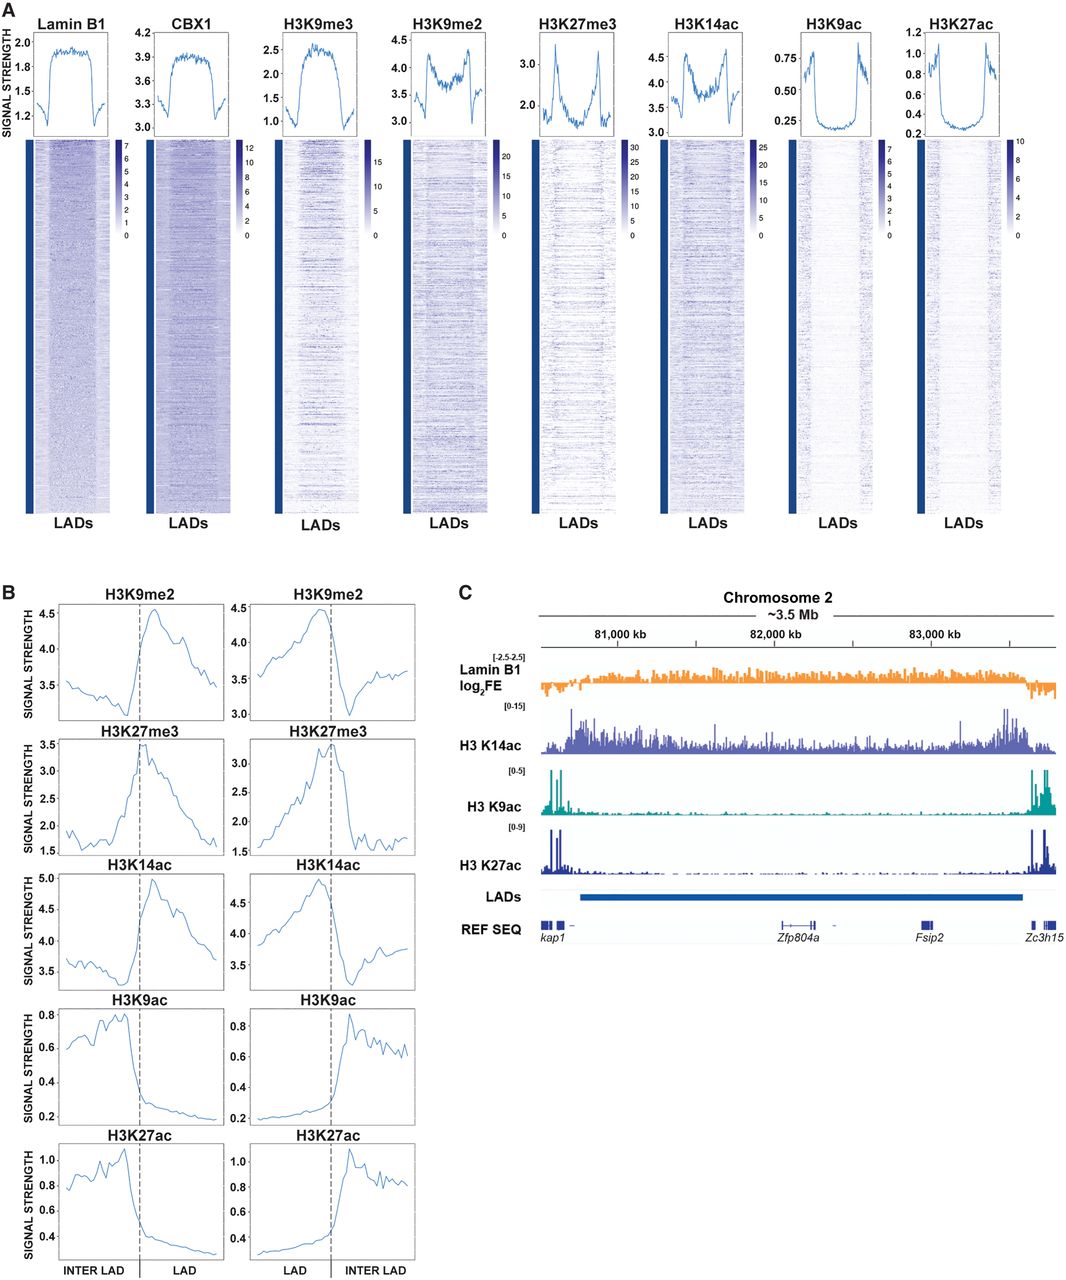
Chromatin profiles across LADs and at LAD borders. (A) Heat maps and profiles of feature abundance across LADs scaled to the same size. Profiles represent the average signal strength (y-axis) from one end of the LAD to the other (x-axis) and extend 300 kb beyond each LAD border. Heat map color intensity denotes signal strength for that feature. (B) Profiles of H3K9me2, H3K27me3, H3K14ac, H3K9ac, and H3K27ac signal around LAD borders. Boxes show a 500-kb window centered around the LAD borders (vertical dotted line). For LADs that are shorter than the 250-kb range shown, the excess area beyond the opposite LAD border was not included to ensure only LAD chromatin was plotted in the area denoted as the LAD interior. (C) IGV browser view of lamin B1, H3K14ac, H3K9ac, and H3K27ac across an example LAD.