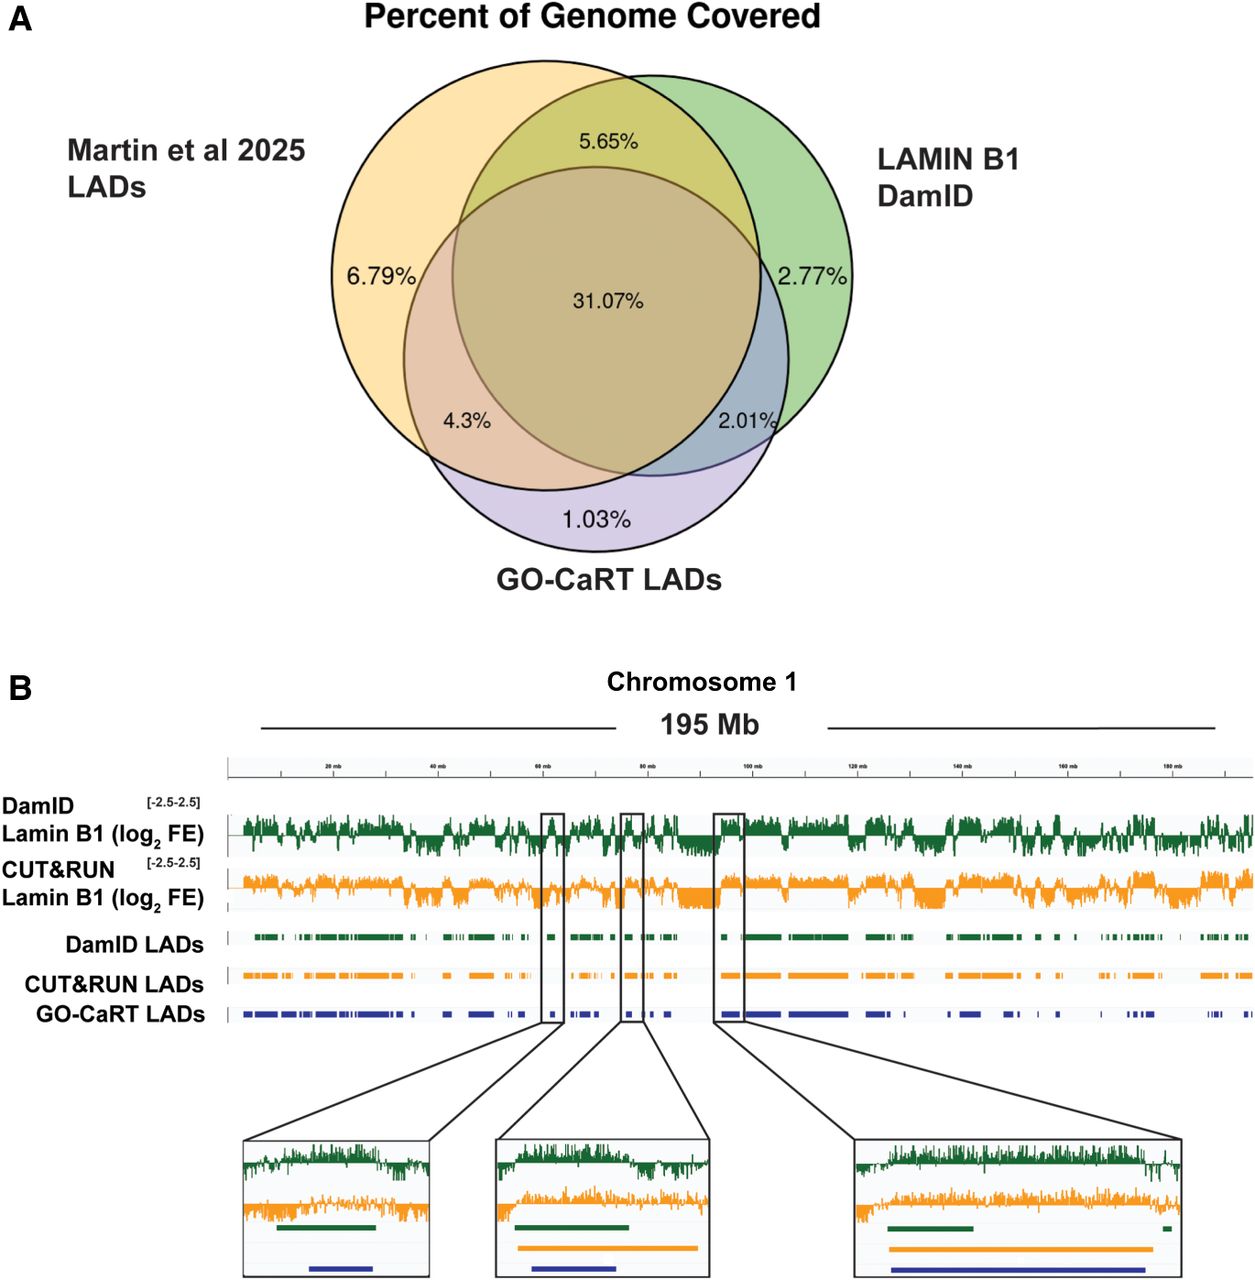
Figure 1.
Mapping chromatin-lamin B1 interactions in MEFs using CUT&RUN. (A) Fraction of base pairs in the genome covered by our CUT&RUN-generated LAD map (yellow), a DamID-generated LAD map in NIH3T3 cells (green), or a CUT&RUN-generated LAD map in NIH3T3 cells (blue). (B) Lamin B1 log2 fold-enrichment over IgG illustrating differences between our CUT&RUN-generated LAD map in and published maps generated by DamID or CUT&RUN in NIH3T3 cells. Left inset shows an example of a LAD called in the DamID data set but not ours. Middle inset shows a LAD called differently between the two data sets for biological or experimental reasons. Right inset shows a LAD called in our data set but only partially in the DamID data set.