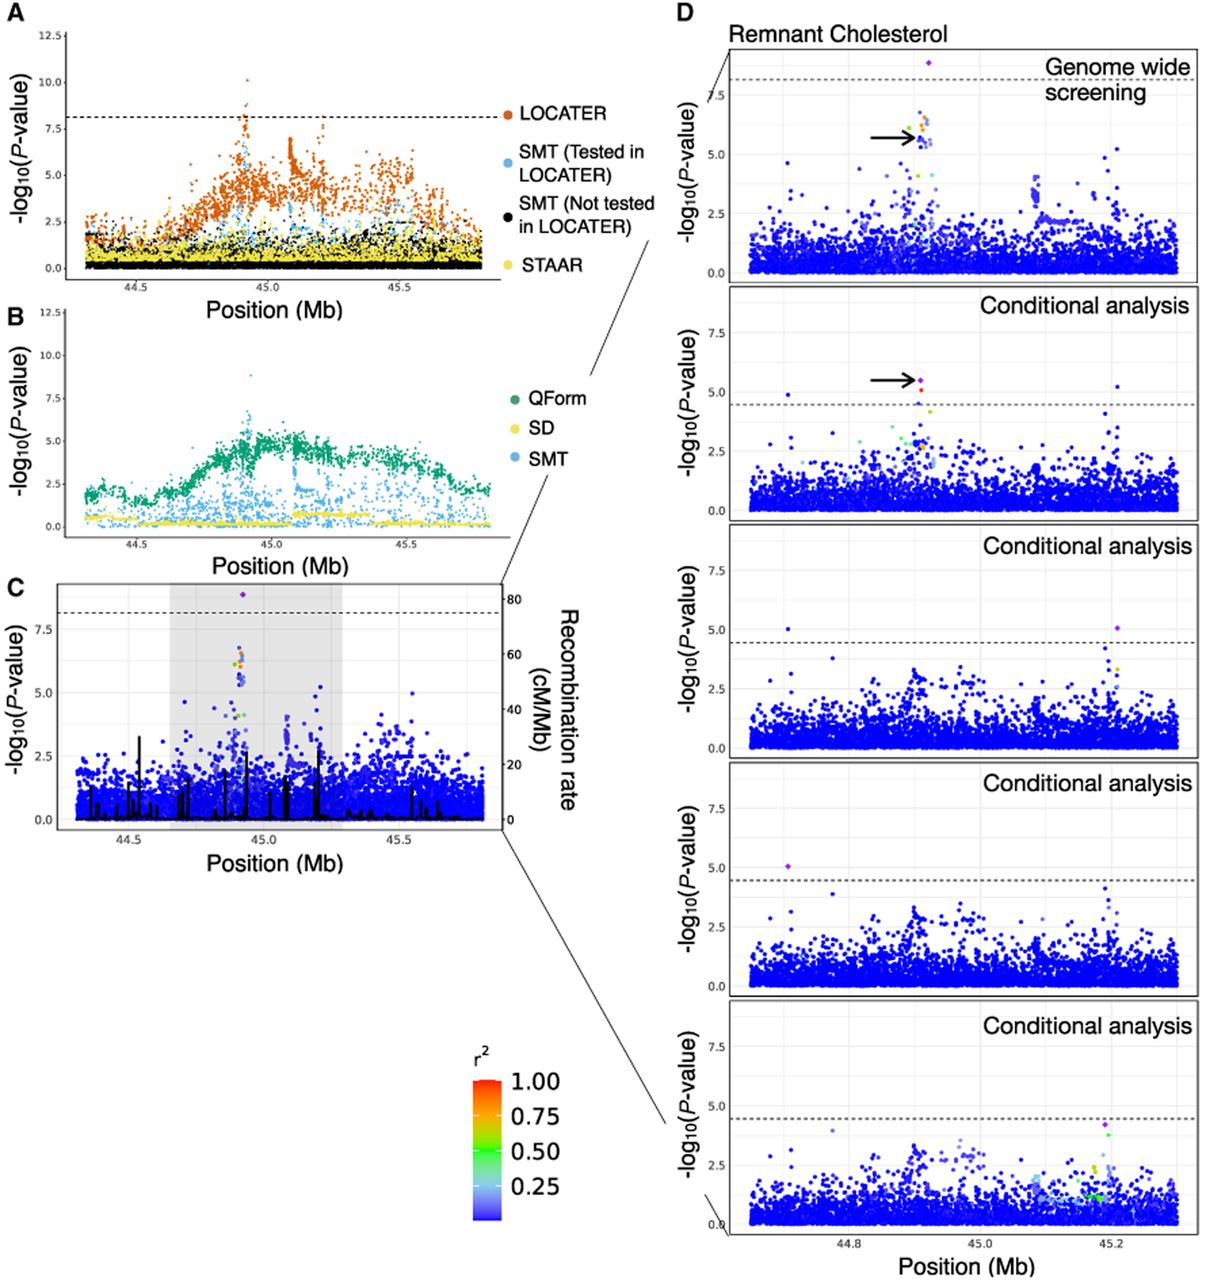
Association of remnant cholesterol at APOE cluster. (A) Local Manhattan plot of the association signal for remnant cholesterol on Chr 19: 44,308,684-45,809,149, shown using the exact same data types and color scheme as Figure 2A. (B) Local Manhattan plot showing modified genomic controlled −log10(P) for the three LOCATER subtests. (C) LocusZoom plot of SMT results. Variants are colored based on their r2 with the SMT lead marker Chr 19: 44,922,203 (purple diamond), in which LD is calculated in the studied samples. The black line shows the recombination rate in Finns (see Methods). Gene annotations are from GENCODE v45. (D) Zoomed in LocusZoom plots showing the original association at top, followed by the results from stepwise conditional analysis. Results were zoomed in based on the shaded region in C. Variants are colored based on their r2 with the SMT lead marker of each experiment (purple diamond). Black arrows point to the most significant variant from the GWAS catalog. The black dashed line corresponds to the genome-wide significance threshold (7.17 × 10⁻⁹) in the top panel, and the conditional analysis threshold (3.52 × 10⁻⁵) for the rest.