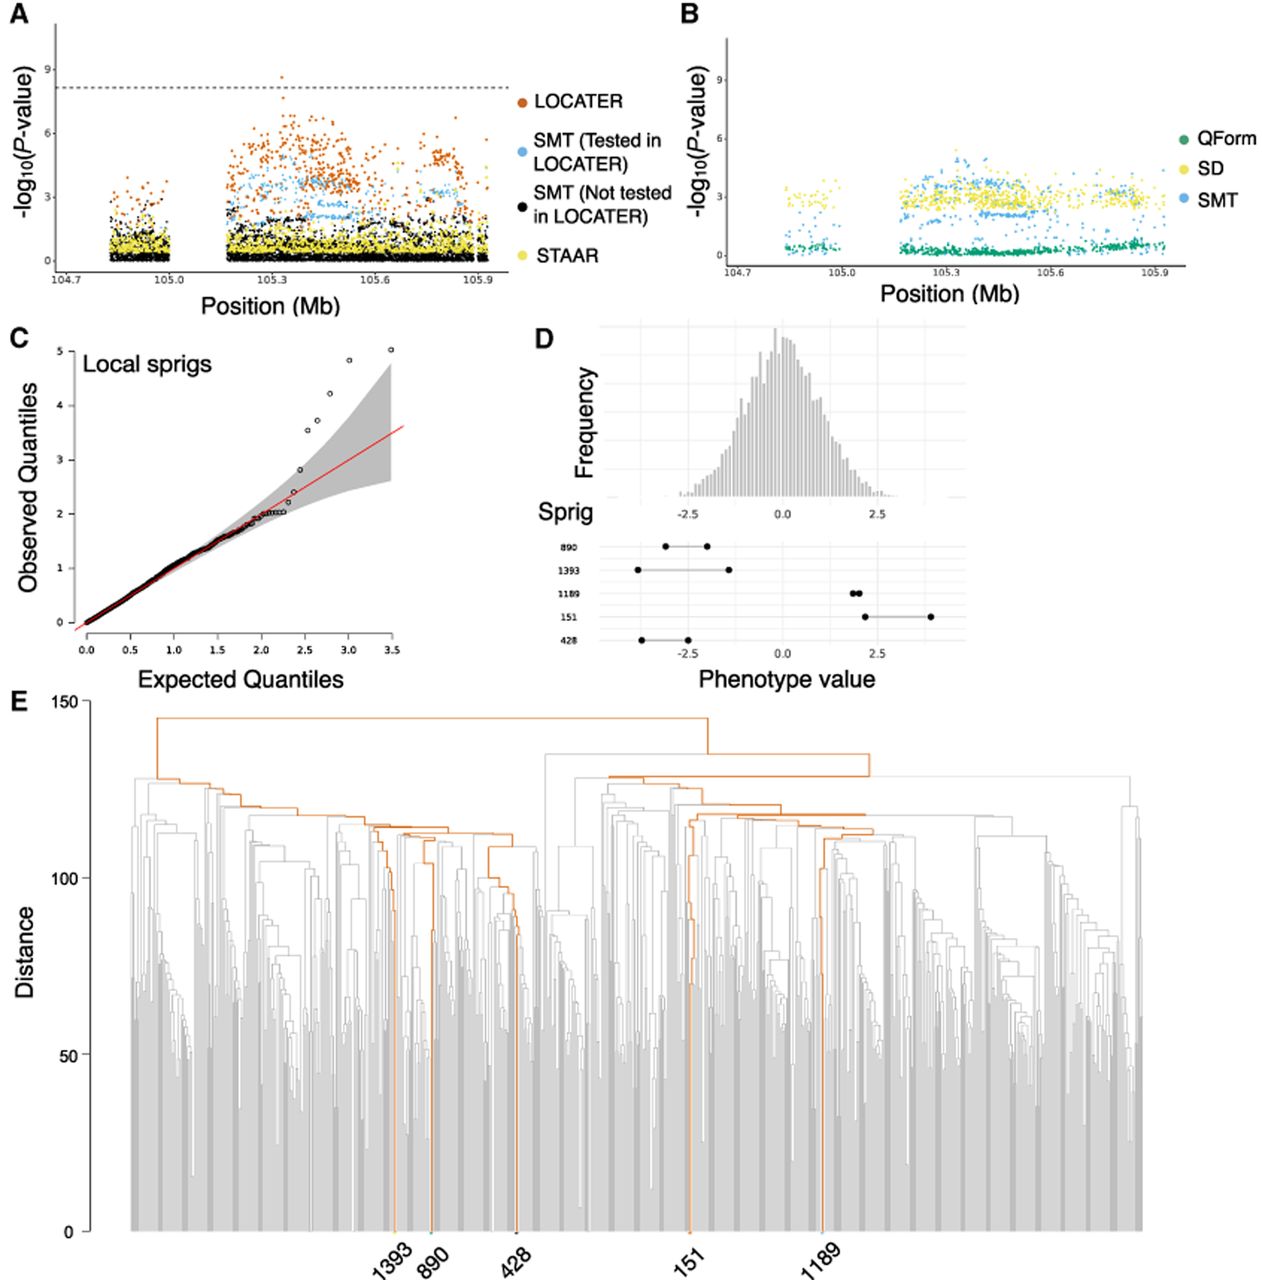
Association of triglycerides in medium VLDL on Chr 11. (A) Local Manhattan plot of the association signal for “triglycerides in medium VLDL” on Chr 11: 104,727,888–105,927,888, shown using the exact same data types and color scheme as Figure 2A. (B) Local Manhattan plot of “triglycerides in medium VLDL” at Chr 11: 104,727,888–105,927,888, showing modified genomic controlled −log10(P) for the three LOCATER subtests. (C) Q–Q inflation plot of −log10(P-values) from all “sprigs” at the lead marker Chr 11: 105,327,888, in which “sprigs” are defined as the smallest possible inferred clades. The gray area corresponds to the 95% confidence interval, and the red line denotes x = y. (D) Histogram of phenotype values after projecting out the genotype vector of the LOCATER lead marker (Chr 11: 105,327,888), thus removing signal that can be accounted for by the SMT subtest. Connected dots show the phenotype value of individuals assigned to significant sprigs. (E) Dendrogram generated from the haplotype-level local distance matrix at the lead marker Chr 11: 105,327,888. The UPGMA method was used for hierarchical clustering. Orange branches highlight the path of all haplotypes in significant sprigs shown previously in part D. Labels at the right show the sprig assignment. For plotting clarity, 95% of haplotypes under insignificant sprigs were pruned.