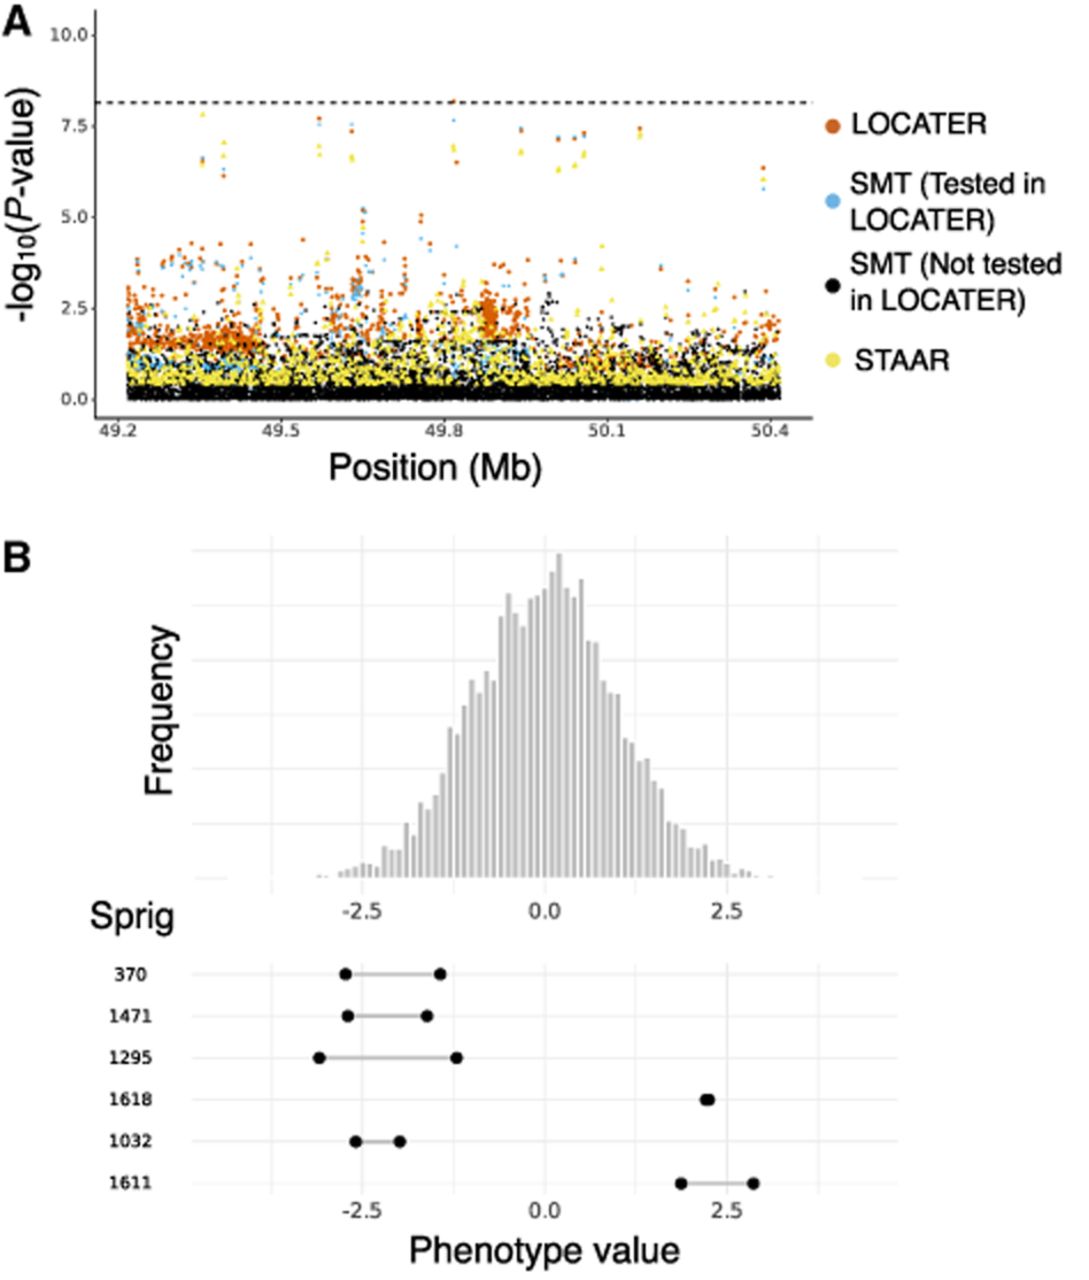
Figure 3.
Association of apolipoprotein A1 at LIPG locus. (A) Local Manhattan plot of the association signal for apolipoprotein A1 on Chr 18: 49,217,040–50,417,040, shown using the exact same data types and color scheme as Figure 2A. (B) Histogram of phenotype values after projecting out the genotype vector of the LOCATER lead marker (Chr 18: 49,817,040), thus removing signal that can be accounted for by the SMT subtest. Connected dots show the phenotype value of individuals assigned to significant sprigs.