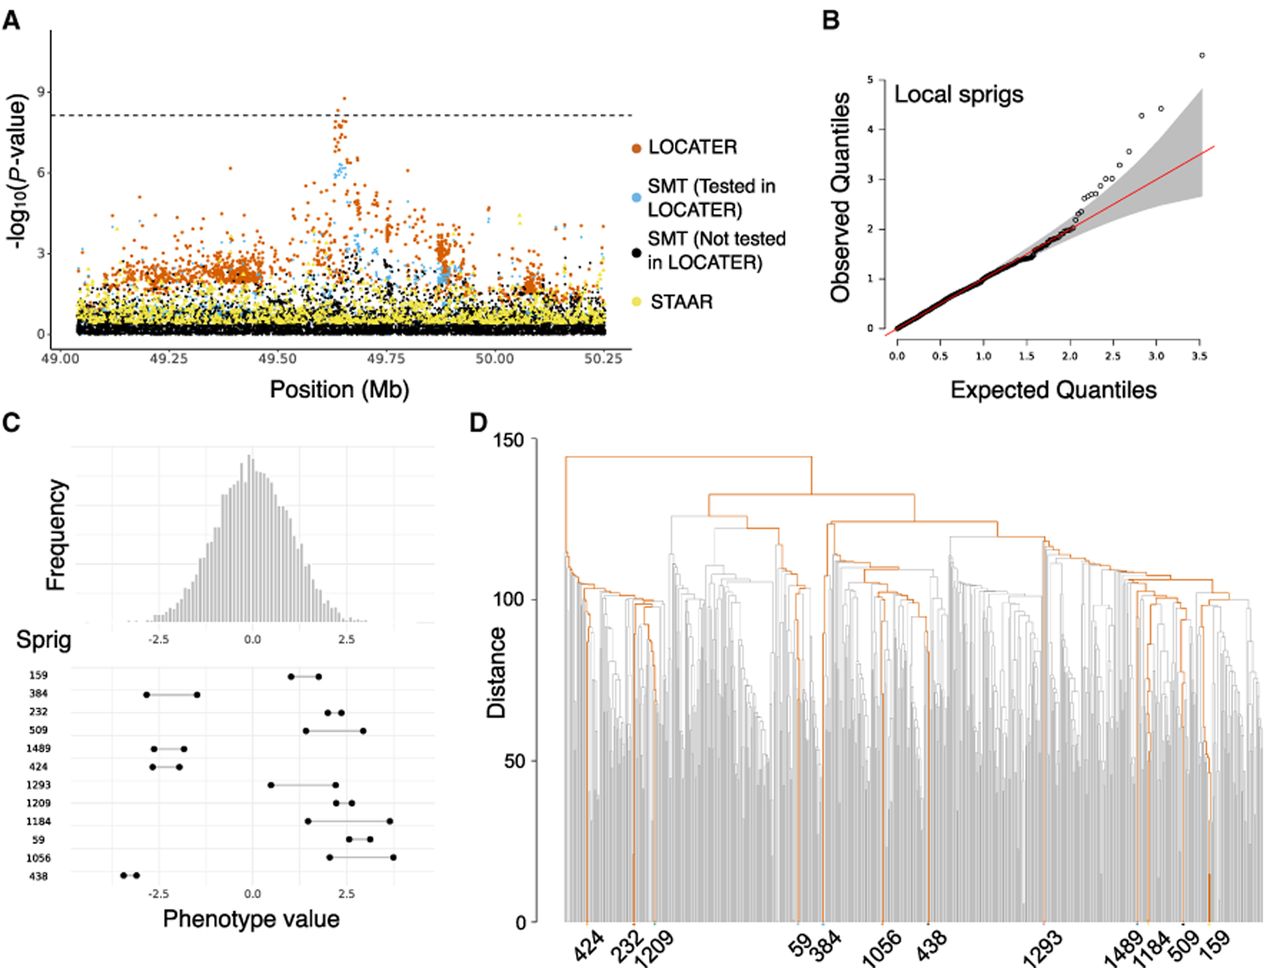
Association of triglycerides in medium HDL at LIPG locus. (A) Local Manhattan plot of the association signal for “triglycerides in medium HDL” on Chr 18: 49,038,347–50,253,146, including results for a single marker test (SMT; blue and black), LOCATER (orange), and STAAR (yellow). Note that LOCATER results are only shown for variants with an SMT P-value <1 × 10⁻³, because for computational efficiency only these variants were tested by LOCATER (see Methods). SMT results from variants tested by LOCATER are shown in blue, and those from variants not tested by LOCATER are shown in black. The black dashed line corresponds to the genome-wide significance threshold for SMT, standardized LOCATER, and standardized STAAR. (B) Q–Q inflation plot of −log10(P-values) from all “sprigs” at the lead marker Chr 18: 49,653,146, in which “sprigs” are defined as the smallest possible inferred clades. The gray area corresponds to the 95% confidence interval, and the red line denotes x = y. (C) Histogram of phenotype values after projecting out the genotype vector of the LOCATER lead marker (Chr 18: 49,653,146), thus removing signal that can be accounted for by the SMT subtest. Connected dots show the phenotype value of individuals assigned to significant sprigs. (D) Dendrogram generated from the haplotype-level local distance matrix at the lead marker Chr 18: 49,653,146. The UPGMA method was used for hierarchical clustering. Orange branches highlight the path of all haplotypes in significant sprigs shown previously in C. Labels at the bottom show the sprig assignment. For plotting clarity, 95% of haplotypes under insignificant sprigs were pruned.