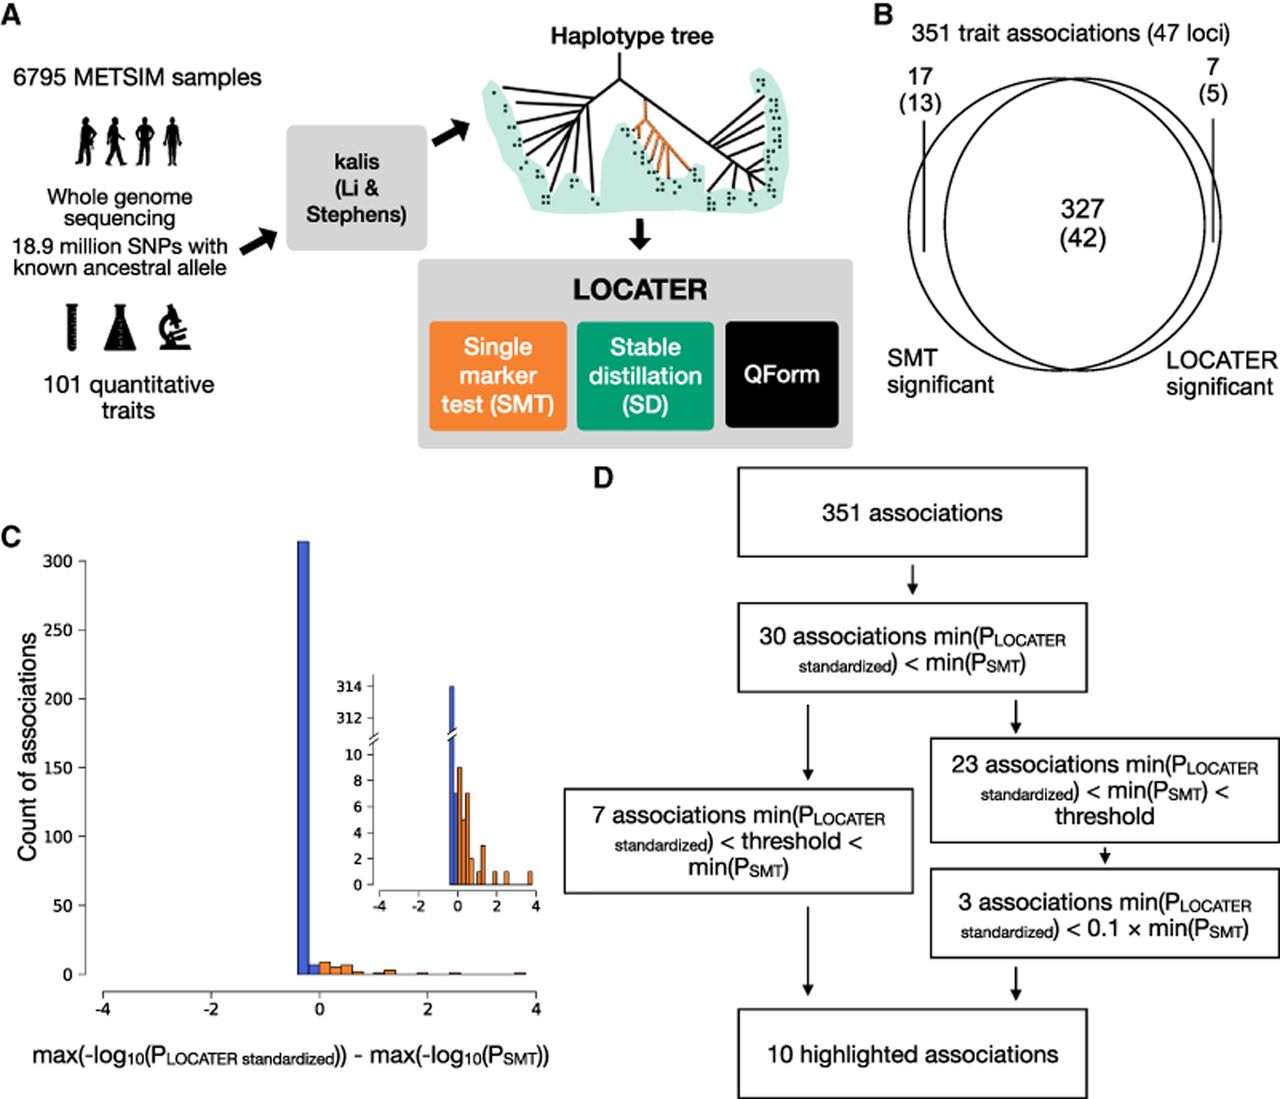
Schematic of our genealogy-based screening procedure LOCATER and summary of screening results. (A) Diagram of the experimental design and association testing method. kalis is an implementation of the Li and Stephens (LS) model for local ancestry inference. (QForm) Quadratic form testing. (B) Venn diagram showing the number of associations and number of loci (in parentheses) with significant SMT and/or significant LOCATER results. Note that a given locus may have distinct associations represented in different parts of the Venn diagram. (C) Distribution of max(−log10(PLOCATER standardized)) − max(−log10(PSMT)) for all 351 associations. All associations that are genome-wide significant by either SMT or LOCATER are included. (D) Overview of significant associations and highlighted associations. The genome-wide significance threshold is 7.17 × 10⁻⁹ for SMT and standardized LOCATER.