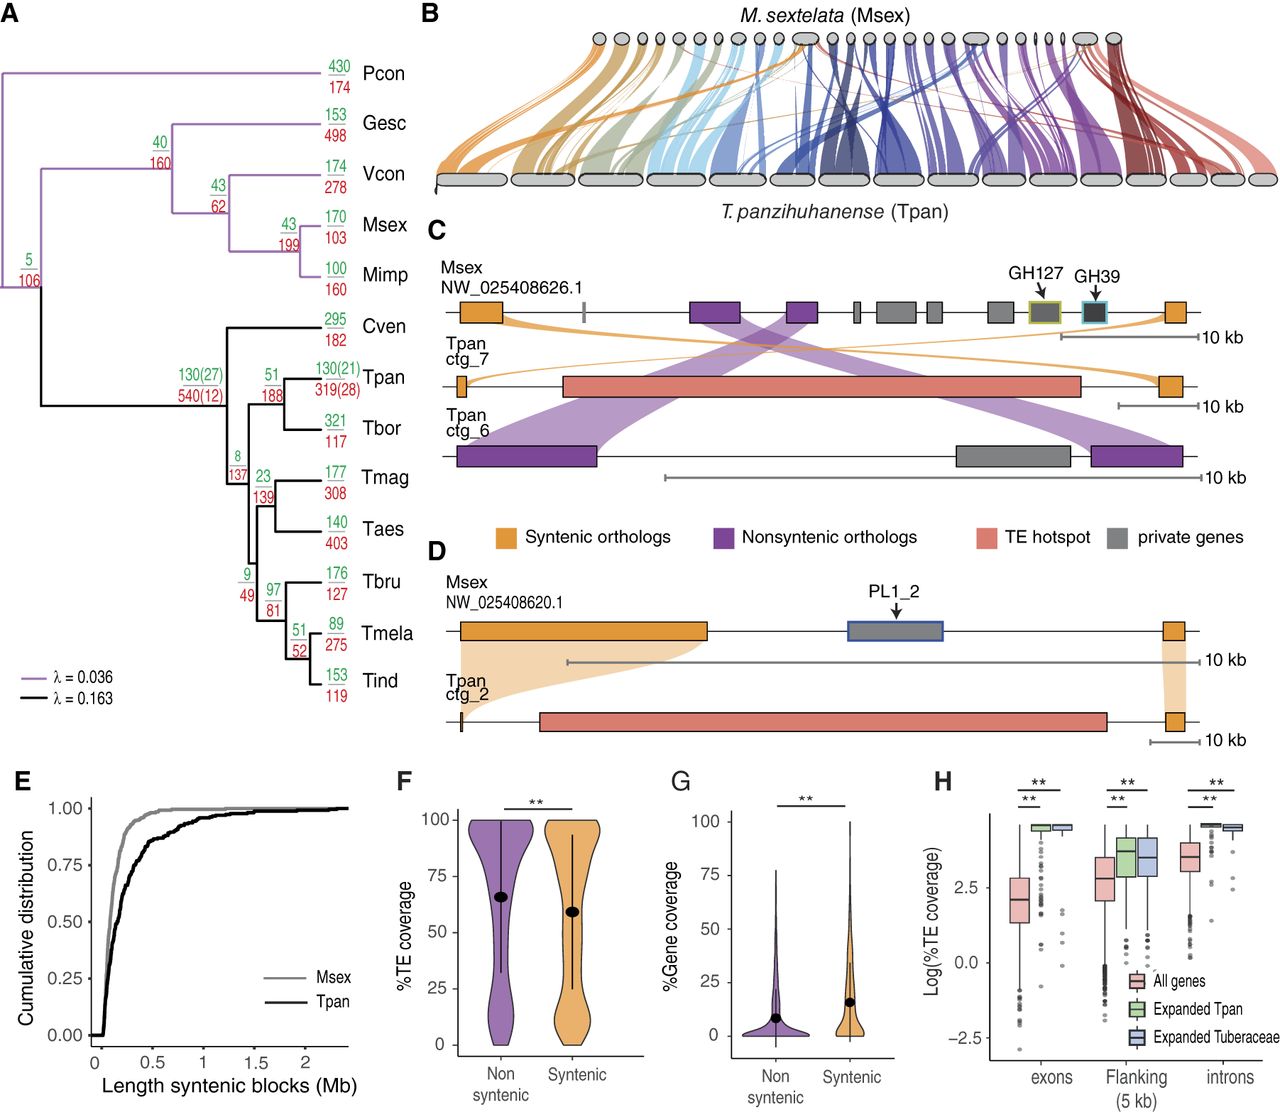
High gene-family turnover rates within Tuberaceae and synteny conservation with Morchellaceae. (A) Gene-family expansions and contractions along the Pezizales phylogeny. At each node, the top number indicates the number of gene-family expansions, and the bottom number indicates the number of contractions. The numbers in parentheses represent the significantly expanded and contracted gene families. (λ) Birth–death model rates fitted with CAFE for Tuberaceae and all other Pezizales species. Species abbreviations are shown in Figure 3. (B) Syntenic relationships between the T. panzhihuanense and M. sextelata genomes. The length of syntenic blocks is proportional to their actual length in base pairs. (C,D) Examples of syntenic genomic regions between T. panzhihuanense and M. sextelata involved in gene loss and small-scale rearrangements. (Private genes) Genes without any known orthologous relationship. Blocks have different scales and are shown at the bottom. (E) Cumulative distribution of the length of syntenic blocks in T. panzhihuanense and M. sextelata. (F,G) Comparison of TE and gene coverage (% of base pairs) across syntenic and nonsyntenic genomic regions in T. panzhihuanense, calculated over nonoverlapping genomic windows of 50 kb. Nonsyntenic genomic regions were found to be significantly more TE-rich and less gene dense (Wilcoxon rank-sum test, P < 0.01). (H) TE coverage (% of base pairs) across exons, introns, and 5 kb of gene-flanking regions for genes belonging to significantly expanded gene families identified in the branch leading to Tuberaceae diversification, as well as in the T. panzhihuanense terminal branch, compared with all other genes. Genes belonging to significantly expanded gene families were found to be significantly more TE-rich across all genomic compartments (Wilcoxon rank-sum test, P < 0.01).