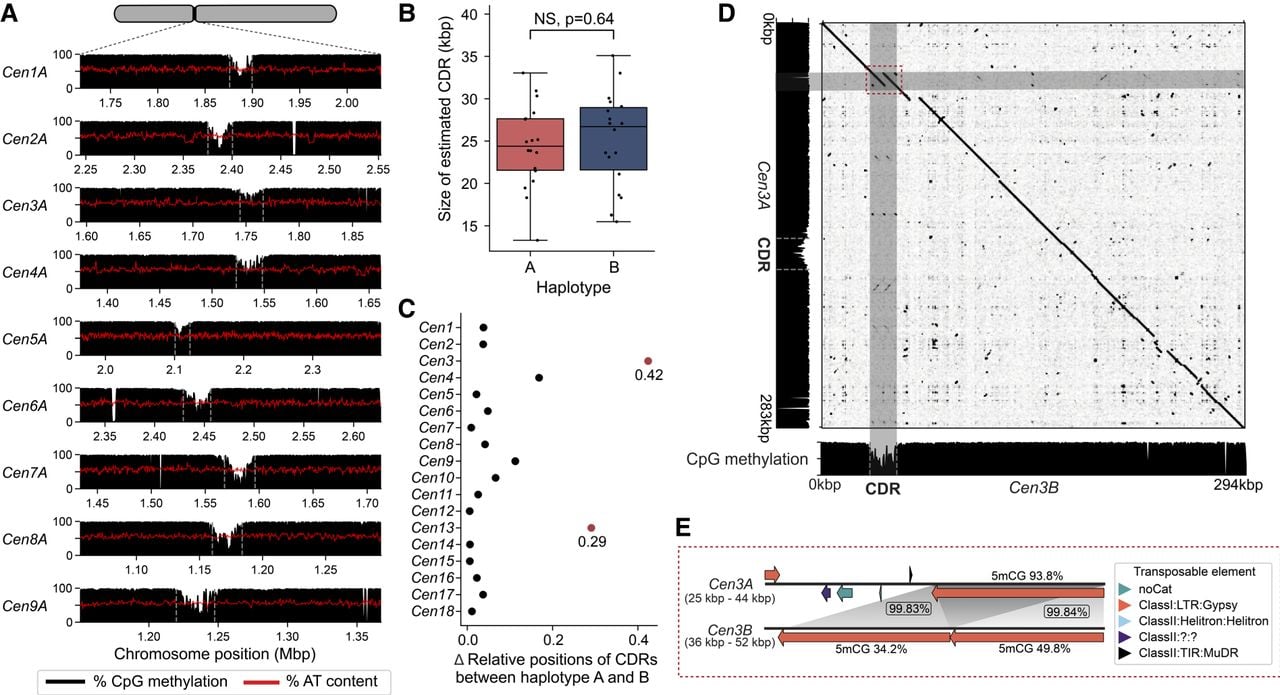
Analysis of centromere dip regions (CDRs) within Pst104E centromeres suggest a single putative kinetochore attachment site per chromosome. (A) CpG methylation profiles (black histograms) and percentage of AT content (red lines) across Pst104E centromeres Cen1A to Cen9A as examples. A consistent methylation depletion valley with a mean size of ∼24.8 kbp was observed throughout all centromeres, indicating CDR signals (marked by gray dotted line). (B) Estimated sizes of the CDRs for each chromosome in haplotype A and B. Student's t-test: (NS) P > 0.05. (C) Differences in the relative positions of CDRs between haplotypes for each homologous chromosome pair. Differences that exceed 0.2 are highlighted in red. (D) Sequence alignment dotplot between Cen3A and Cen3B and their respective CpG methylation profiles (black histograms). The dotted red box highlights sequence divergence between Cen3A and Cen3B corresponding to the Cen3B CDR. (E) Detailed synteny analysis of the region highlighted in D. Long orange arrows indicate copies of hapB-B-G1437-Map9 belonging to the Ty3/Gypsy LTR retrotransposon superfamily. Gray shading indicates homologous sequences with percentage identity shown in boxes. Numbers above and below the orange arrows indicate the respective percentage of methylated CpGs.