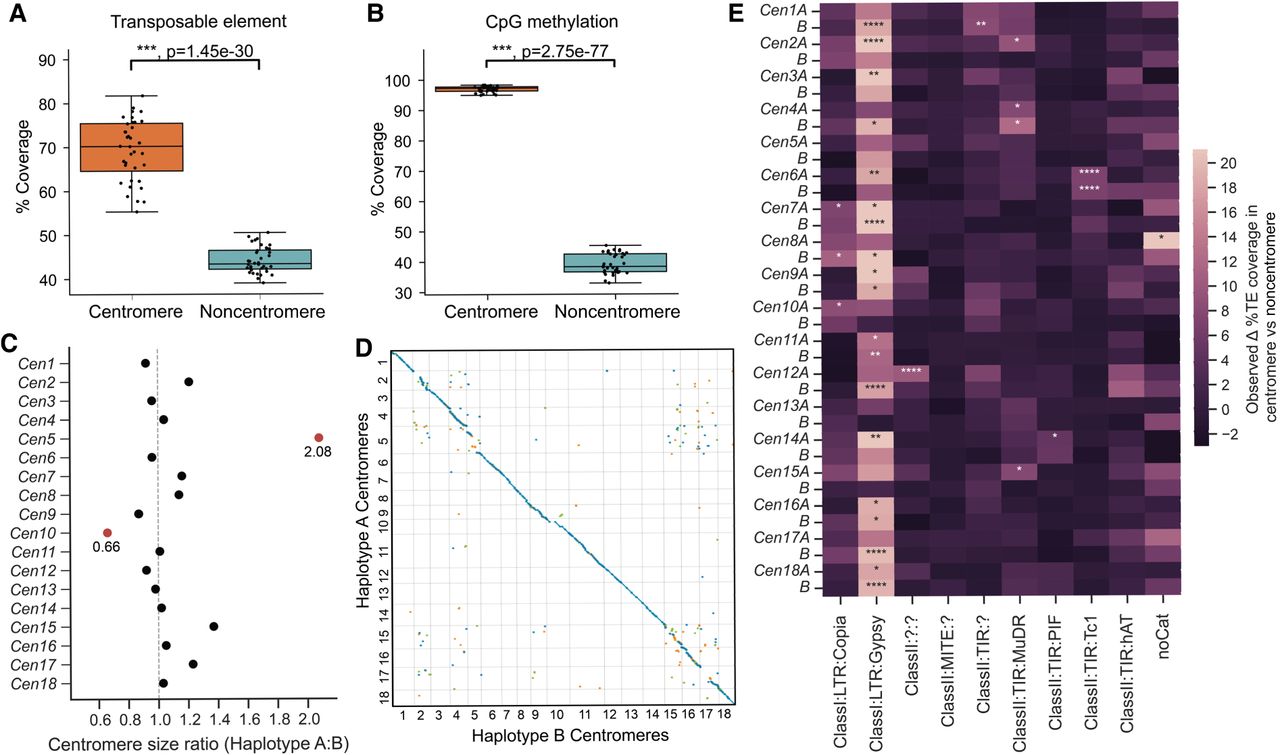
Pst104E centromeres are highly diverse with haplotype-specific sequences and are enriched in retrotransposons. (A) Percentage of TE coverage in centromere and noncentromere regions of Pst104E. Each dot represents one of the 36 chromosomes. Student's t-test: (***) P < 0.001. (B) Percentage of coverage of methylated CpG sites in centromere and noncentromere regions of Pst104E. Each dot represents one of the 36 Pst104E chromosomes. Student's t-test: (***) P < 0.001. (C) Size ratio of haplotype A centromeres compared to haplotype B centromeres. Outlier ratios exceeding 1.5 times the interquartile range are highlighted in red. (D) Pairwise alignment dotplot between centromeres of haplotypes A and B. Only alignment blocks >100 bp with a minimum of 90% sequence identity are shown. Each color denotes an alignment type: blue, unique forward alignments; green, unique reverse alignments; and orange, repetitive alignments. (E) Enrichment of TE superfamilies within centromeres compared with noncentromere regions. Statistical significance was assessed using permutation tests on each chromosome. Only abundant TE superfamilies with >1% of total genome coverage are shown. The color scalebar denotes the test statistic, defined as the observed difference in the percentage of TE coverage within and outside centromeres. P-values represent the proportion of permuted values equal to or more extreme than observed. FDR < 5% was applied to correct for multiple testing: (*) P < 0.05, (**) P < 0.01, (****) P < 0.0001.