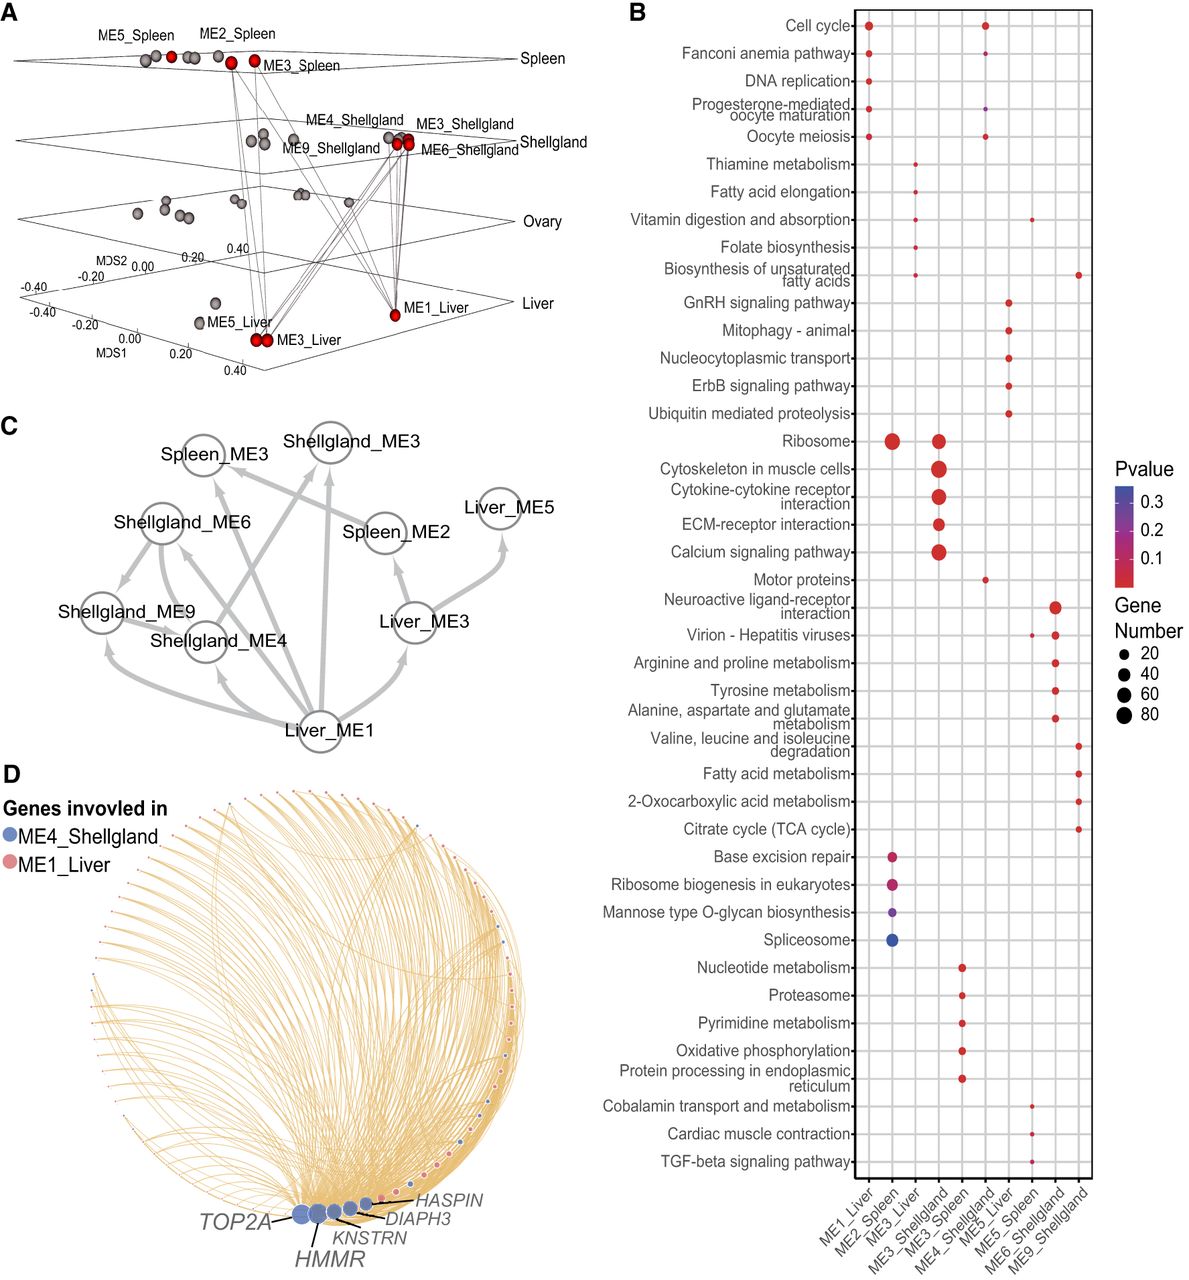
Cross-tissue regulatory landscape of duck egg production. (A) Multidimensional scaling (MDS) plot among gene coexpression modules. Each point represents a module, and the distances between points reflect their dissimilarity. Axes MDS1 and MDS2 correspond to the first and second dimensions of the MDS projection, which capture the major structure of the inter-module relationships. Each panel represents a different tissue, and red points indicate modules significantly associated with egg production (|Pearson correlation coefficient| > 0.2; FDR < 0.05). Lines connecting points across panels represent modules from different tissues that share similar expression patterns (|Pearson correlation coefficient| > 0.4; FDR < 0.05). (B) The KEGG enrichment results for genes in modules associated with duck total egg production. (C) The causal regulatory relationships among modules associated with duck egg production. The direction of the arrows indicates the inferred regulatory direction between modules. (D) The case of cross-tissue regulatory network between Liver_ME1 and Shell gland_ME4. The red and blue dots stand for genes in Liver_ME1 and shell gland_ME4, respectively. The size of each point reflects the cross-tissue connectivity degree of the corresponding gene.