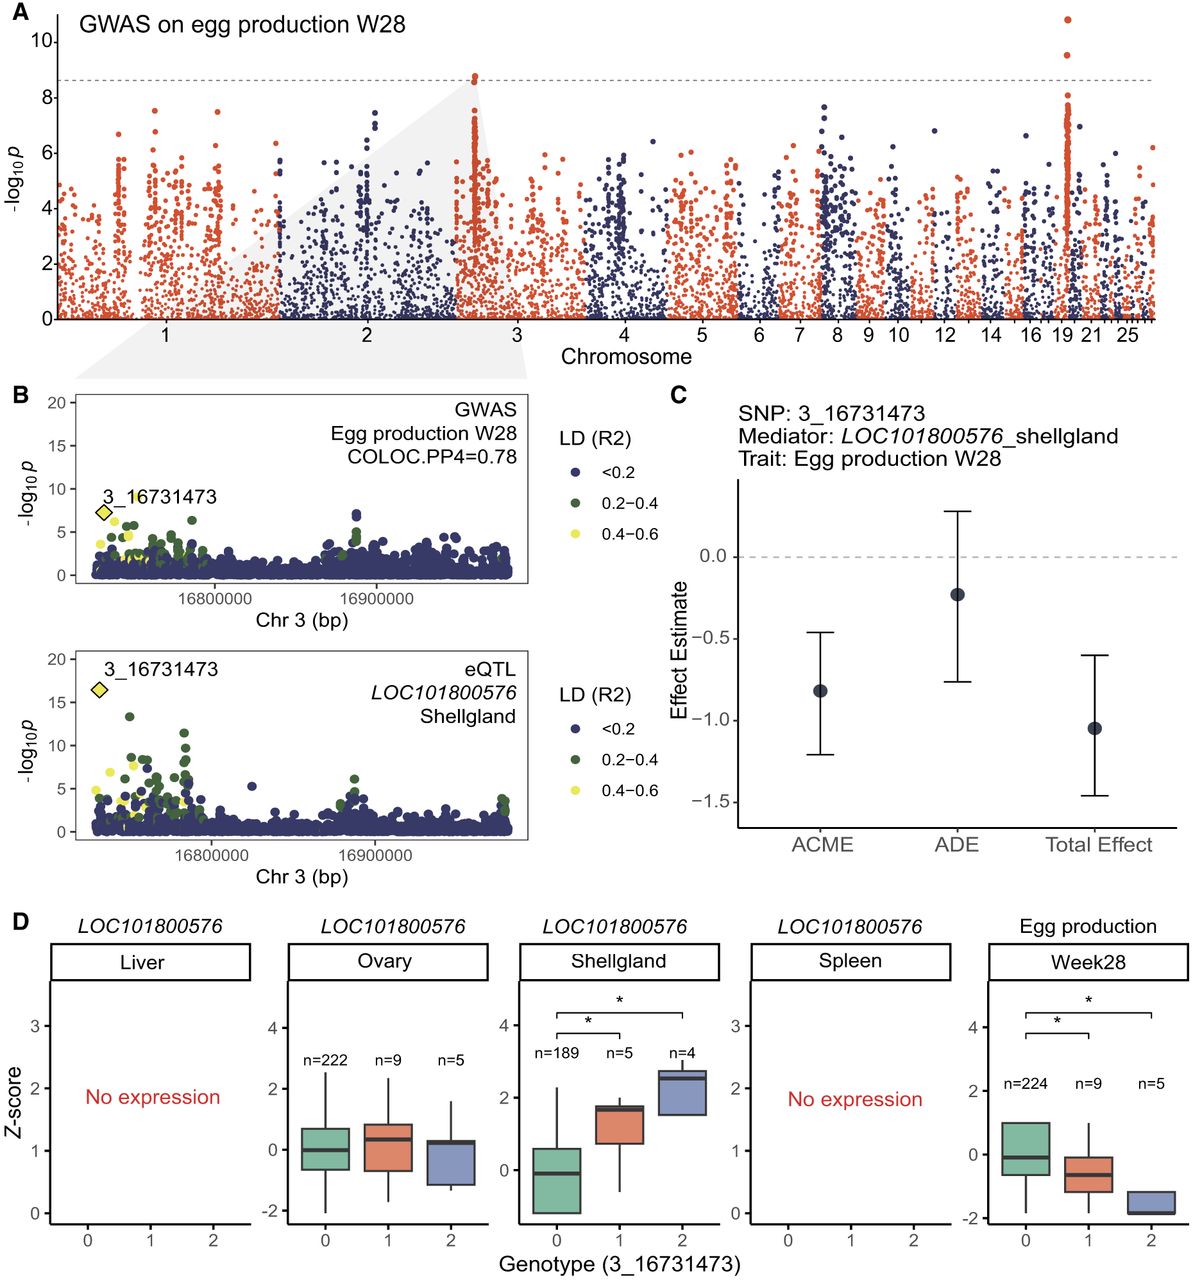
Figure 5.
Colocalization between egg production and LOC101800576 expression in shell gland. The specific legends for similar graphs can be found in Figure 4. (A) Manhattan plot of the GWAS on egg production W28. (B) Colocalization analysis between egg production W28 GWAS and the LOC101800576 eQTL in shell gland. (C) Effect estimates from causal mediation analysis. (D) The expression of LOC101800576 across all tissues and egg production W28 stratified by the genotype of variant 3_16731473.