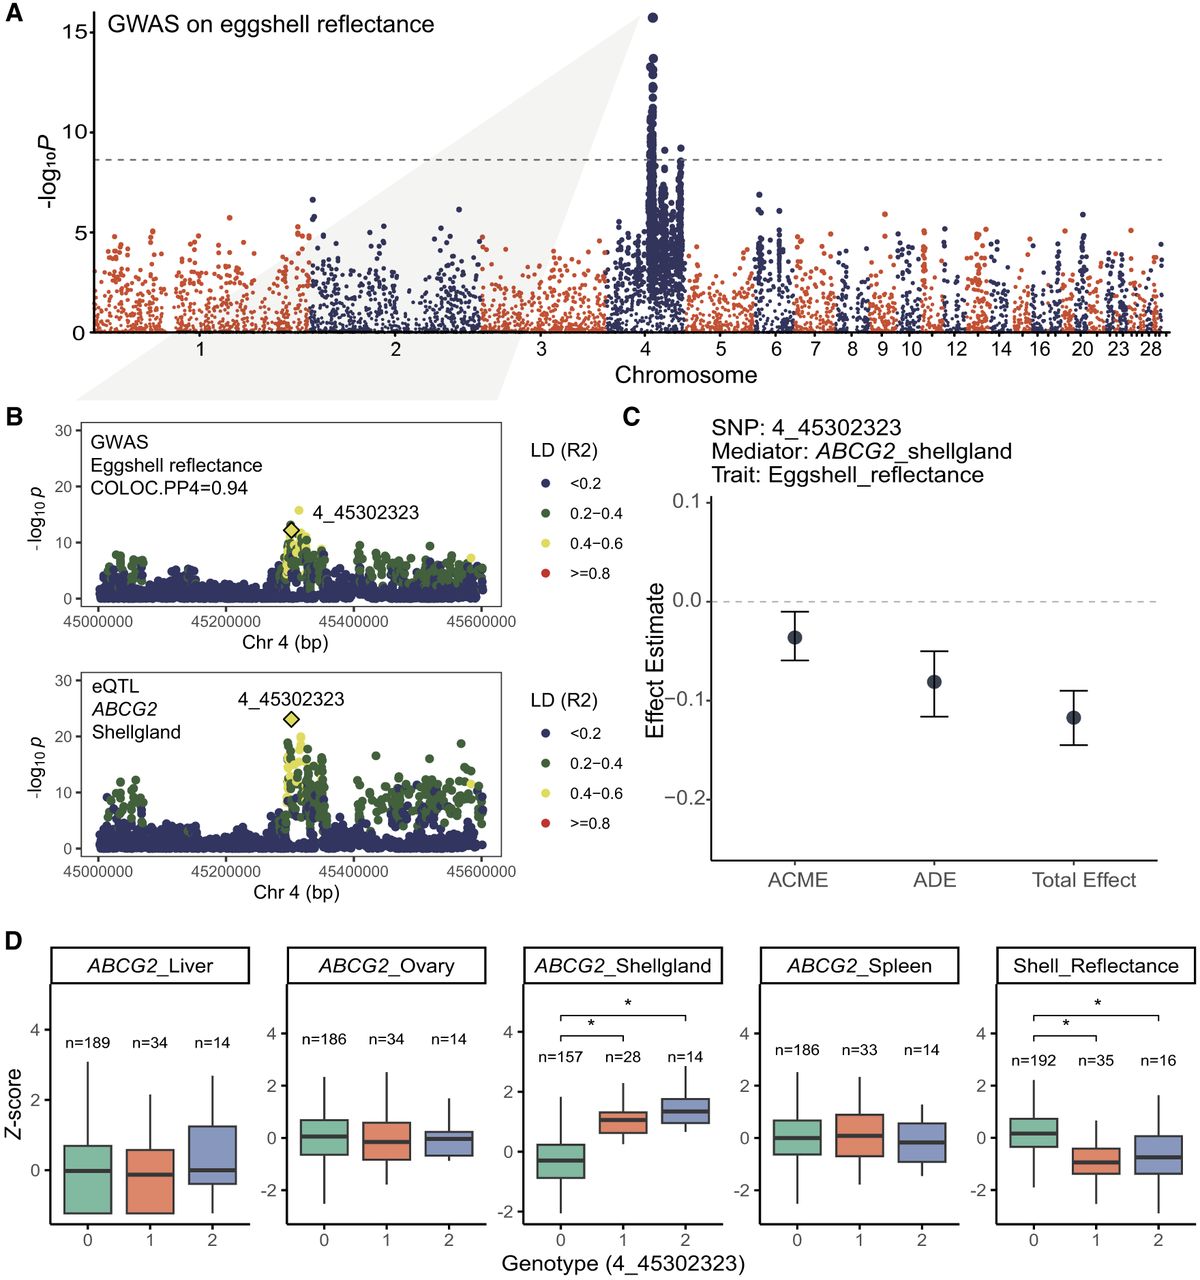
Colocalization between duck eggshell color and ABCG2 expression in the shell gland. (A) Manhattan plot of the GWAS for eggshell reflectance. The x-axis indicates chromosomal positions, and the y-axis shows −log10P representing association significance. (B) Colocalization analysis between eggshell reflectance GWAS and the ABCG2 eQTL in the shell gland. The highlighted variant (4_45302323) represents the most likely shared causal variant, as indicated by its SNP-level PP4 value. (C) Effect estimates from causal mediation analysis. (ADE) average direct effect of 4_45302323 on eggshell reflectance, (ACME) average causal mediation effect through ABCG2 expression in the shell gland, and (total effect) overall effect of 4_45302323 on eggshell reflectance. (D) The expression of ABCG2 across all tissues and eggshell reflectance stratified by the genotype of variant 4_45302323. Both expression levels and phenotypic values are shown as Z-score standardized values. Asterisks indicate significant differences between genotypes (Wilcoxon test, P < 0.05).